A Study on Stream Data Processing for Sensor Network of Smart Healthcare System
Copyright ⓒ 2022 The Digital Contents Society
This is an Open Access article distributed under the terms of the Creative Commons Attribution Non-CommercialLicense(http://creativecommons.org/licenses/by-nc/3.0/) which permits unrestricted non-commercial use, distribution, and reproduction in any medium, provided the original work is properly cited.

Abstract
In this context, this paper seeks to increase the processing performance of multi-dimensional stream data continuously transmitted from multiple sensors taking into account the energy efficiency and accuracy of the sensor network in the smart healthcare system. For efficient input stream processing, we proposed an efficient processing technique to process queries based on sliding window, establish multiple query plans using Multi-Join method, and reduce the number/amount of the stored data using backpropagation algorithm. As a result of performance evaluation using 28,648 data points, the proposed processing technique was shown to be effective by reducing 19.5% of the storage space compared to the actual input data.
초록
본 논문에서는 스마트 헬스케어 시스템 내 센서 네트워크의 에너지 효율성과 정확성을 고려하여 여러 센서에서 지속적으로 들어오는 다차원 스트림 데이터의 처리 성능을 높이고자 한다. 효율적인 입력 스트림 처리를 위해서 슬라이딩 윈도우 기반으로 질의를 처리하고 Multi-Join 방법으로 다중 질의 계획을 수립한 후 역전파 알고리즘을 통해 저장 데이터를 축소하는 효율적인 처리 기법을 제안하였다. 28,648개의 데이터 집합을 사용하여 성능 평가한 결과 실제 입력되는 데이터보다 저장 공간의 19.5%를 축소함으로써 효과적임을 보였다.
Keywords:
Backpropagation Algorithm, Sensors Network, Sensors Data, Smart Healthcare System, Stream Data키워드:
역전파 알고리즘, 센서 네트워크, 센서 데이터, 스마트 헬스케어 시스템, 스트림 데이터Ⅰ. Introduction
With recent surge of interest in extending life span and improving quality of life, coupled with the aging world population, the main concern of healthcare is shifting from curing disease to minimizing the possibility of disease occurrence. In addition, Internet of things(IoT) technology is evolving into a smart system that helps people interact with things by connecting networks to things, and diverse related studies are underway [1][2]. The IoT is realizing a “super-connected society” that provides new services and useful values to users and enables them to learn and use information from its position anchored deep inside their lives [3]. IoT devices such as wearables, smart phones, and tablet PCs recognize surrounding situations with various sensors and communication functions and collect data in real time, which leads to the accumulation of vast amount of data [4]. Due to the irregularity of the data generation cycle, the data transmitted from sensors are nonlinear and inconsistent, reflecting the characteristics and methods of the sensor-generated time series data [5]. For this reason, many sensors are required to collect data in the IoT environment, and an efficient method is required for processing the sensor data collected through sensor networks. The data collected from the sensor networks in the IoT environment are fast and continuous stream data. Due to the continuity and complexity of such stream data, only a temporary access is possible, and due to the constant dynamic change using limited memory, a continuous data processing model is required [6].
In the meantime, in many stream data research areas, techniques for establishing a join query plan have been studied within a limited scope with respect to cost and storage space efficiency [7]. In addition, a join query is required to process huge amount of data acquired from multiple sensors, unlike those from a single sensor. Join operators can use the hash table-based, window-based, or hash table-window-based approach. Of them, the hash table-window-based join operator is the most suitable processing method for the data stream environment for its advantages of working fast within a limited memory and rapidity of matching. Among the hash table-window-based join operators, the MJoion operator was proposed for its ability to take multiple inputs, given that joining multiple pieces of information can yield a result with over more comprehensive content [8][9].
The smart healthcare system in IoT environment requires faster processing of stream data because multi-dimensional data should be processed at the same time. Considering this aspect, the Multi-Join operator, a hash table-window-based join operator, was used in this paper to optimize query. Meanwhile, the existing research on stream data has primarily focused on data analysis and clustering rather than on the hardware part. With overemphasis on enhancing query efficiency and stream-processing performance, no proper research has been dedicated to problem solving related to efficient stream data storage. Against this background, this paper makes an attempt at data classification and reduction using the backpropagation algorithm to ensure efficient storage and management of stream data [10][11].
In this paper, multiple sensors (systolic blood pressure, diastolic blood pressure, weight, and pulse) were installed in a smart healthcare system in an IoT environment, and queries were processed based on a sliding window for efficient input stream processing, multi-query plans were set up using the Multi-Join operator, and modeling was performed using the backpropagation algorithm. The performance of the constructed model was evaluated by comparing it with the K-NN algorithm and analyzing the results.
The remainder of this paper is arranged as follows: Chapter 2 describes the system configuration and design; Chapter 3 presents system implementation and performance evaluation; Chapter 4 presents conclusions and future research directions.
Ⅱ. System Configuration and Design
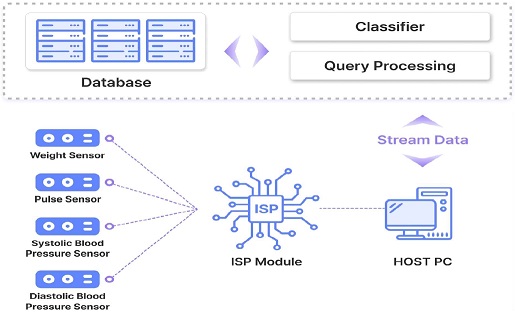
In this paper, pre-clustering is performed after scanning the entire database prior to processing input stream data from each sensor. After pre-clustering, the stream data is stored, and the queries are processed and stored in the database. The stored data is classified with the backpropagation algorithm to reduce the data. The process board used to construct the proposed system is MCU and CC2431 Radio Chip (MSP430, Telos platform series). In addition, an integrative sensor module combining the systolic blood pressure, diastolic blood pressure, weight, and pulse sensors were used, with a total of 10 sensor nodes, including one sink node. For real-time analysis, it is important to quickly and accurately classify the features analyzed from bio-signals. Since bio-signals have different characteristics for each individual, generalizing classifiers is also an important issue as much as increasing the accuracy of classifiers. The availability of quick and easy classifiers is an important variable in classifier selection. The backpropagation algorithm enables classification even for insufficient input data. In addition, it has a parallel processing function of data, so it can produce an appropriate output through sufficient classifier training even for complex inputs. Figure 1 is a schematic diagram of the proposed system.
Multiple sensors were used to collect stream data (systolic blood pressure, diastolic blood pressure, weight, and pulse) for sensor data processing of the proposed system. Since the data collected for analysis were obtained in the same environment, different types of data were bundled into one packet for query processing and transmission to the database because a separate packet is made for each input data type, data transmission requires additional traffic and energy consumption. The total length of the packet is 36 bytes, consisting of the fixed header (10 bytes), sensor node ID and channel (6 bytes), and buffer (20 bytes). The buffer was designed for the actual sensed values to enter in the order of systolic blood pressure, diastolic blood pressure, weight, and pulse as hexadecimal 3 bytes each to occupy 12 bytes starting from the buffer head.
The data structure includes 1 byte for each bundle, with the 7th and 8th values from the left allocated to the communication method, the 15th and 16th values to the channel, and from the 17th to the 28th to the systolic blood pressure, diastolic blood pressure, weight and pulse values.
An important part to enable stream data processing is to efficiently satisfy the query of sensing data taking into account the limited resources of sensor nodes for sensing information scattered across the sensor network environment of the IoT; that is, to enable a query processing that can maximize the accuracy and speed while minimizing the energy consumption rate in each sensor node [12].
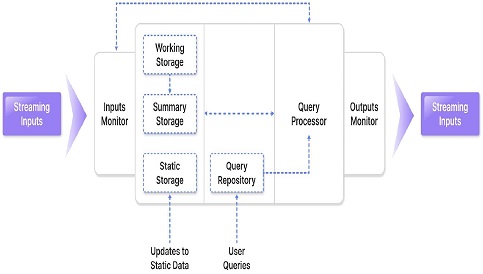
Figure 2 is a structural diagram of stream data management with a stepwise description of the query processing in the data stream environment. Stream data management performs multiple continuous query processing on multiple stream data, during which the processing capacity of the system can be exceeded due to overload of input data. Data storage is done in three parts: temporary working storage, summary storage for stream synopsis processing, and static storage for metadata processing.
The query to be executed is stored in the query storage, and the query processor carries out optimization for query processing according to the amount of input data.
In order to get comprehensive information from the smart healthcare sensor network in the IoT environment, it is necessary to perform a join operation based on a specific time or location to get the desired result.
Existing stream data research proposed a technique for establishing a query execution plan for join queries in terms of cost and storage space efficiency. A join operator can be hash table-based, window-based, or hash table-window-based. Of them, the hash table-window-based join operator is the most suitable processing method for the data stream environment for its advantages of working fast within a limited memory and rapidity of matching. Among the hash table-window-based join operators, the Multi-Join operator that can take multiple inputs has been proposed from the point of view that the result of joining several pieces of information includes more comprehensive contents [10].
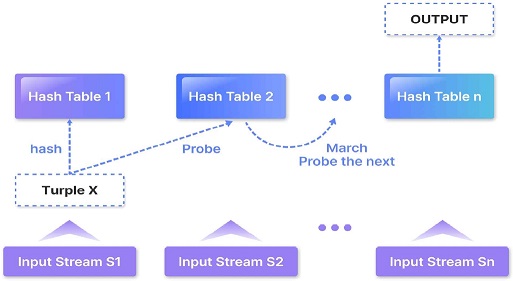
In this paper, query plans were set up using the hash table-window-based Multi-Join method. Multi-Join can efficiently perform the join of frequently changing data stream. It is an extension of the symmetric hash algorithm designed to enable multiple stream processing. For each input tuple, it is checked iteratively whether a tuple with the same key exists in all hash tables. Since the join query based on a general binary join has a problem of blocking because the query execution plan is set up in the form of a binary tree. In a data stream environment, a potentially infinite amount of data is continuously entered into the system, which causes the blocking query execution plan to exceed the limit of the system’s memory capacity and requires sampling or load shedding of the input stream.
Multi-Join was proposed as an efficient join processing technique for multidimensional stream data that can have multiple input streams, breaking away from the binary join-based form. Multi-Join has been evolved from the traditional symmetric hash join. In other words, unlike the conventional symmetric hash join, it can have multiple inputs, which makes it possible to export intermediate results as join results with multiple streams without passing the intermediate result over to the next operator. Figure 3 shows the processing structure of Multi-Join. If a new tuple comes in from the input stream S1, it is inserted into the hash table for S1 and the hash table for the next input stream is checked. If the newly input tuple matches all the values in the other hash table, the output is returned. The purpose of this paper is data classification and reduction for efficient storage and management of stream data taking into account the smart healthcare system in the IoT environment.
Although various learning algorithms are available, the data used in this performance evaluation are systolic blood pressure, diastolic blood pressure, weight, and pulse data, whose compositional structure is nonlinear. Due to this nonlinear data structure, a backpropagation algorithm that can solve the nonlinear discrimination problem with a multi-layer perceptron structure is used.
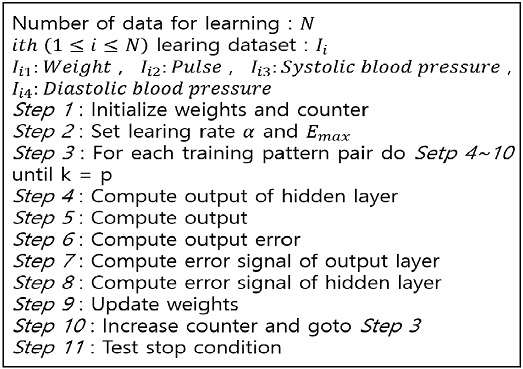
The backpropagation algorithm learns by adjusting the weight of a hidden layer, thus obtaining higher accuracy compared with other learning algorithms. The backpropagation algorithm iteratively multiplies and adds the input values with the weight of the neural network, and yields the output (y) as the result of the input values, where the output (y) is different from the desired output (o) set in the training dataset. That is, an error (e=y-o) amounting to (y-o) occurs in the neural network, and the weight of the output layer is updated in proportion to the error, and then the weight of the hidden layer is updated accordingly. The direction of weight updating is opposite to the processing direction of the neural network. This is the reason why it is called a backpropagation algorithm. That is, neural network processing proceeds in the direction of input layer → hidden layer → output layer, whereas the learning direction of weight update proceeds in the direction of output layer → hidden layer. In this paper, a neural network with two level output layer was constructed to process the error rate according to the window size change using four input data (systolic blood pressure, diastolic blood pressure, weight, and pulse).
- (1) The number of nodes in the input layer has to be 4, the number of the data items.
- (2) The output layer corresponds to Level 1 if the first node is selected by a weight learned through the input data.
- (3) The number of nodes in the hidden layer is one or more. As the number of hidden layers increases, the learning time increases, so it is important to determine the optimal number of hidden layers.
Figure 4 is a flowchart of the backpropagation algorithm.
Ⅲ. System Implementation Results and Performance Evaluation
In this paper, as measure of performance evaluation, the query accuracy in Database was measured. Using a total of 10 nodes consisting of one sink node and nine intermediate nodes, the output data for systolic blood pressure, diastolic blood pressure, weight, and pulse values were transferred to the stream data storage every five seconds. The collected data is stored in the database after the processes of query processing in the stream data management and the backpropagation algorithm classification. The performance of the proposed system was tested using 28,648 collected sensor data (systolic blood pressure, diastolic blood pressure, body weight, pulse). The experimental data used for performance evaluation being irregular data measured in real-world settings, it is necessary to measure the error rate, unlike in linear relations. The process board used for performance evaluation is MCU and CC2431 Radio Chip (MSP430, Telos platform series), and the error rate was measured at each size change of the sliding window, using root mean square error (RMSE) as defined by Equation (1).
| (1) |
In this paper, the error rates of the backpropagation algorithm and the K-NN algorithm were compared after query processing based on sliding window and multi-query planning using the Multi-Join method for efficient input stream processing. As a result, the error rate of the backpropagation algorithm was found to be lower than that of the K-NN algorithm by 1.91% on average, and the stored valid data reduced by the backpropagation algorithm were used for the smart healthcare system in the IoT environment.
Table 3 show the results of data reduction by the backpropagation algorithm by dividing the window size into 1000, 2000, and 3000 in line with the number of tuples using 28,648 data points. As a result of the performance evaluation, it was found that the maximum reduction of storage space of 19.5% was attained when the window size was divided by 3000. The classification accuracy also the highest accuracy of 91.3% when the window size was divided by 3000.
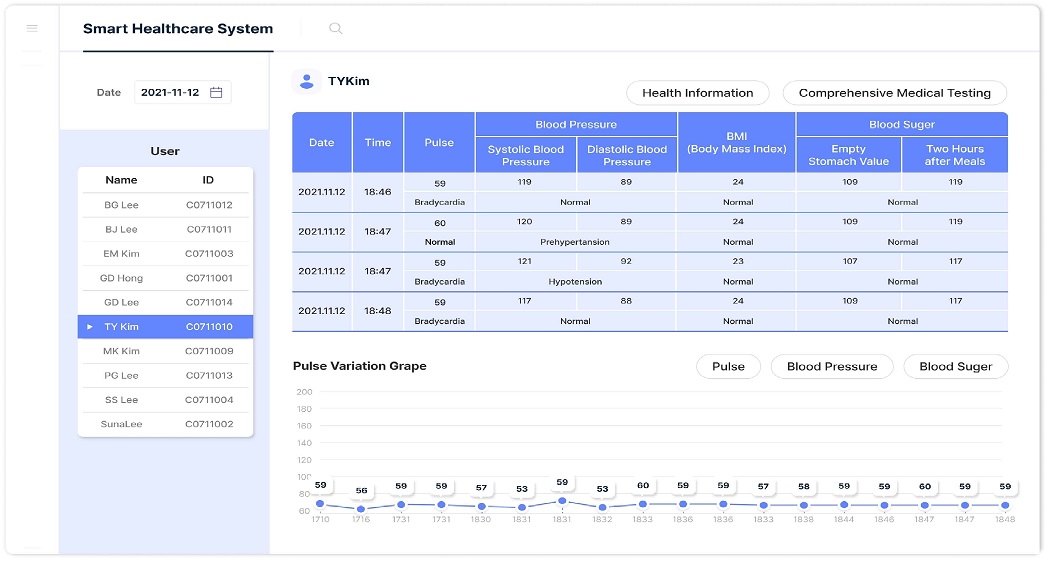
Finally, a smart healthcare system was implemented using the classified data. The smart healthcare system consists of two sets of items: items that monitor the classification result of the sensed data and numerical data by time and date and graph items that show changes in systolic blood pressure, diastolic blood pressure, weight, and pulse, respectively. Figure 5 shows the result of smart healthcare system implementation.
Ⅳ. Conclusions
The smart healthcare system allows users to receive their health care services in real time anytime, anywhere. This is in tune with the increasing demand for specialized and diversified as well as personalized healthcare services, as health is increasingly becoming the central value of society, all the more so with increasing penetration of the IoT in our daily lives. Also, with increasing application of the network technology in the IoT environment in line with rapid technical development and implementation, countless stream data are collected in real time smart healthcare system from a wide variety of sensors carried by users. Stream data requires efficient energy storage and management because the data distribution can change over time and a large amount of data is collected in a short time.
In this study, based on these considerations, multiple sensors (systolic blood pressure, and diastolic blood pressure, weight, and pulse) were arranged, efficient query processing based on sliding window was performed for efficient input stream data processing, multiple query plans were set up using hash table-window-based Multi-Join method, the error rates of the backpropagation algorithm and the K-NN algorithm were compared. The performance evaluation using 14,324 data points yielded the following results: the average error rate of the backpropagation algorithm was 2.42%, and that of the K-NN algorithm 4.33%, proving the superiority of the backpropagation algorithm to the K-NN algorithm with a 1.91% lower error rate; the amount of data classified through the backpropagation algorithm occupied 19.5% less storage space on average than the actual input data; the classification accuracy was the highest with 91.3% when the window size was divided by 3000.
For future research, it is planned to develop a more efficient algorithm taking into account the processing time. Also in planning is a study on time-based sliding window query processing for processing time-dependent data. Another research plan of interest is the construction of an integrated system that may provide decision-making support for healthcare staff by developing a method efficiently processing various biometric information such as user location information, brain waves, blood sugar level, and body fat.
Acknowledgments
This study was supported by research funds from Chosun University, 2020.
References
- J. S. Song, S. J. Kim, and Y. T. Shin, “Apriori Based Big Data Processing System for Improve Sensor Data Throughput in IoT Environments,” KIPS Transactions on Computer and Communication Systems, Vol. 10, No. 10, pp. 277-284, October, 2021.
-
G. Teng, Y. He, H. Zhao, D. Liu, J. Xiao, and S. Ramkumar, “Design and development of human computer interface using electrooculogram with deep learning,” Artificial intelligence in medicine, Vol. 102, pp. 101765, January, 2020.
[https://doi.org/10.1016/j.artmed.2019.101765]

- M. J. Lee, J. S. Lee and Y. S. Han, “Adaptive priority Queue-driven Task Scheduling for Sensor Data Processing in IoT Environments,” Journal of Korea Multimedia Society, Vol. 20, No. 9, pp. 1559-1566, September, 2017.
-
Z. Zhou, H. Yu, and H. Hhi, “Human activity recognition based on improved bayesian convolution network to analyze health care data using wearable IoT device,” IEEE Access, Vol. 8, pp. 86411-86418, May, 2020.
[https://doi.org/10.1109/ACCESS.2020.2992584]

- J. Y. Kim, I. Sim, and S. H. Yoon, “Artificial Intelligence-based Classification Scheme to improve Time Series Data Accuracy of IoT Sensors,” The Journal of the Institute of Internet, Broadcasting and Communication, Vol. 21, No. 4, pp. 57-62, August, 2021.
-
T. Y. Kim, S. H. Bae, and Y. E. An, “Design of smart home implementation within IoT natural language interface,” IEEE Access, Vol. 8, pp. 84929-84949, May, 2020.
[https://doi.org/10.1109/ACCESS.2020.2992512]

- C. W. Byun, H. Z. Lee, and S. Park, “MMJoin: An Optimization Technique for Multiple Continuous MJoins over Data Streams,” Journal of KIISE: Databases, Vol. 35, No. 1, pp. 1-16, February, 2008.
- S. A. Lee, J. H. Kim, S. H. Shin and S. B. Nam, “Implementation of Storage Manager to Maintain Efficiently Stream Data in Ubiquitous Sensor Networks,” Journal of the Institute of Electronics Engineers of Korea, Vol. 46, No. 3, pp. 24-33, May, 2009.
-
T. Y. Kim, S. H. Kim and Y. D. Ahn, “Sliding Window based Sensor Data Processing in IoT Environment,” Journal of Digital Contents Society, Vol. 21, No. 4, pp. 825-832, April, 2020.
[https://doi.org/10.9728/dcs.2020.21.4.825]

- K. J. Kim, S. Y. Oh, and M. S. Lee, “Pattern Classification for IoT Stream Data using Convolutional Neural Networks,” Journal of KIISE, Vol. 35, No. 2, pp. 106-115, August, 2019.
-
R. Sahal, J. G. Breslin, and M. I. Ali, “Big data and stream processing platforms for Industry 4.0 requirements mapping for a predictive maintenance use case,” Journal of Manufacturing Systems, Vol. 54, pp. 138-151, January, 2020.
[https://doi.org/10.1016/j.jmsy.2019.11.004]

- J. H. Song, and M. S. Lee, “Design and Implementation of a Window Pattern Recognition and Storage System for IoT Stream Data,” Journal of KIISE, Vol. 34, No. 2, pp. 46-58, August, 2018.
저자소개

2003 : Department of Computer Science and Statistics, Graduate School of Chosun University (M.S. Degree)
2015 : Department of Computer Science and Statistics, Graduate School of Chosun University (Ph.D Degree)
2012~2015 : Director of Shinhan Systems Co., Ltd.
2012~2017 : Adjunct Professor, Gwangju Health University
2018~now : Assistant Professor, Chosun University
※Research Interest: AI, Big Data, Emotion Technology, IoT

1984 : Department of Computer Electrical Engineering, Graduate School of Chosun University (M.S. Degree)
1988 : Department of Information Science, Graduate School of Tokyo Metropolitan University (Ph.D Degree)
1985 : Researcher, Department of Electrical Engineering, Tokyo Institute of Technology
1997 : Visiting Professor, Department of Information Engineering, Nara Institute of Technology
2002 : Visiting Professor, Department of Information Engineering, University of Alberta
2012~2013 : Directors, NRF
1988~now : Professor, Department of Computer Science and Statistics, Chosun University
※Research Interest: AI, Multimedia
