Investigation the relationship between road surface temperature and weather conditions using a vehicle attached sensors
Copyright ⓒ 2020 The Digital Contents Society
This is an Open Access article distributed under the terms of the Creative Commons Attribution Non-CommercialLicense(http://creativecommons.org/licenses/by-nc/3.0/) which permits unrestricted non-commercial use, distribution, and reproduction in any medium, provided the original work is properly cited.

Abstract
Winter roads often lead to inferior conditions to drivers. The freezing and thawing cycle leads to a decreased friction coefficient in wet or snowy weather when compared to dry roads. This leads to an increase in possibility of traffic accidents during the winter. Therefore, collecting accurate information on road surface temperature is crucial to provide a safe and efficient winter road environment. This study collects surface temperature, atmospheric temperature, humidity, vehicular ambient temperature, and GPS data through a thermal mapping system. The collected data is transformed into a database format that can be analyzed, and the correlation between the road surface temperatures is identified using two statistical tests. These can provide great insights of necessary parameters for forecasting the road surface temperature by statistical results.
초록
동절기 도로는 운전자에게 매우 위험한 주행환경을 제공한다. 일반적으로 습하거나 눈이 많이 오는 날씨에는 건조한 도로에 비해 마찰계수가 감소한다. 이는 겨울철 교통사고의 발생 가능성을 높이는 결과로 이어진다. 따라서 안전하고 효율적인 동절기 도로주행환경을 제공하기 위해서는 노면온도에 대한 정확한 정보를 수집하는 것이 매우 중요하다. 본 연구에서는 이동식 노면온도 측정시스템을 이용하여 도로의 노면온도, 대기온도, 대기습도, 차량의 주변온도 및 GPS 데이터를 수집하였다. 수집된 데이터의 전처리 과정을 통해 분석을 위한 DB를 구축하고 두 가지 통계적 테스트를 통해 노면온도와 기상조건 간의 상관관계를 파악하였다. 분석결과는 향후 노면 온도를 예측하는 데 필요한 기초자료로 활용될 수 있을 것이다.
Keywords:
Vehicular ambient temperature, Thermal mapping system, Road surface temperature, Statistical test, Road maintenance키워드:
차량 외기온도, 이동식 노면온도 측정시스템, 노면온도, 통계분석, 도로 유지관리Ⅰ. Introduction
A road surface can immediately freeze after rain during the winter[1]. For example, when it rains, air temperature generally decreases, and thus wet roads tend to be freezing. In addition, snow cover on the road can repeatedly cause freezing and thawing due to changes in temperature. The road surface friction coefficient changes according to road surface condition. When road surface becomes wet or freezing, the road surface friction coefficient tends to be lower than dry condition of road surface[2]. Furthermore, the road surface temperature at night differs by more than 10℃ compared with daytime during the winter season[3, 4]. The freezing and thawing cycle decreases the friction coefficient in wet or snowy conditions when compared to dry roads. Freezing rain, which occurs frequently during the winter season, can decrease the level of traffic safety. According to the U.S. Federal Highway Administration, 1,836 deaths and 136,309 injuries per year were caused by icing or snowfall on the road during the winter[5]. In addition, traffic accidents during the winter season are about 19% higher and the number of people injured by traffic accidents is about 13% higher when compared to other seasons[6]. Importantly, freezing rain during the winter forms unstable traffic flow[7]. Therefore, collecting accurate information on road surface temperature is crucial to provide a safe and efficient winter road environment.
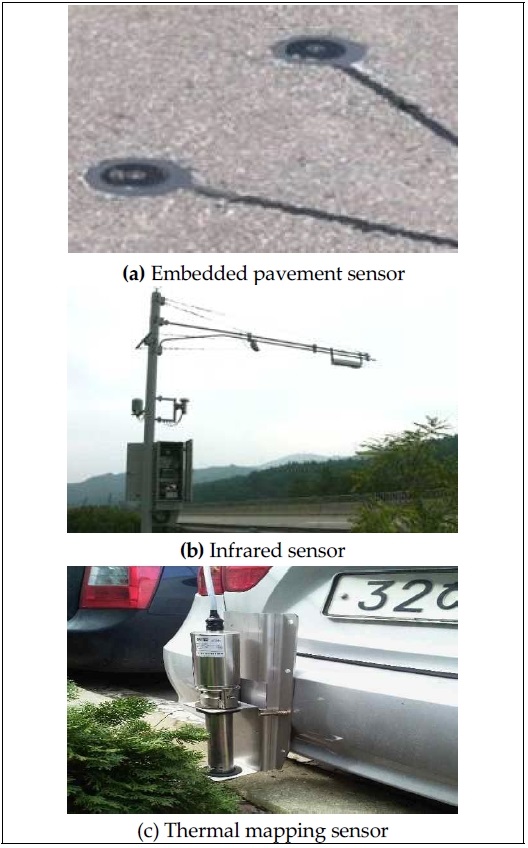
The road surface temperature can be measured using a road weather information system (RWIS) or a thermal mapping system (TMS)[8]. There are two sensors used in a RWIS: an embedded pavement sensor and infrared sensor installed on the road shoulder. A RWIS can only collect road surface temperature data for a single point on the road. On the other hand, a TMS can be equipped on a vehicle, and collect road surface temperature data over entire road sections while driving[9]. Typically, the variables affecting road surface temperature are roadside temperature, atmospheric temperature, and humidity. Of these, the roadside temperature is defined as the atmospheric temperature between 9m and 14m above the road surface[3].
In this study, temperature sensors were attached to the front and rear of the survey vehicle. The roadside temperature was assumed to be the same as the temperature collected from the vehicular ambient temperature sensor. They were attached to both the front and back of the survey vehicle because the location of them diff ers between vehicle manufacturers.
This study collected surface temperature, atmospheric temperature, humidity, vehicular ambient temperature, and GPS data through a TMS. The collected data was transformed into a database format for analysis, and the correlation between the road surface temperatures was identified using two statistical tests.
Ⅱ. Materials and Methods
2-1 Literature Review
The survey vehicle, equipped with a TMS, repeatedly drove the same route over the same time under different weather conditions in the winter and collected data for surface temperature, atmospheric temperature, humidity, vehicular ambient temperature, and GPS. A thermal map was constructed based on the road surface temperature information from the collected data. To increase the reliability of the thermal map, mathematical filtering methods were used[10].
A TMS is typically used to measure the lowest road surface temperature under various weather conditions. The road surface temperature was measured using the TMS for more than 100,000 km of the roads and airports in the United States, Canada, Europe, and Japan[11, 12]. The TMS measurement is mainly conducted by the highway agencies. To maximize the spraying of snowplows, a TMS is used to identify the optimal paths, locations, and numbers of snow removal vehicles. Therefore, predicting the freezing of the road surface is highly crucial.
According to the study using a TMS in Korea, the road topography and local climatic factors or topographical factors such as tunnels and bridges can affect the road surface temperature[13]. A road surface temperature model based on the RWIS was developed, and its predicted values were compared with the actual road surface temperature collected from the TMS. In 2010, Korea Expressway Corporation implemented a TMS for the freeway[14]. This TMS showed lower consistency of collecting data. However, it is meaningful that it was the first attempt to build a freeway TMS in Korea and utilize it for winter road operation[15].
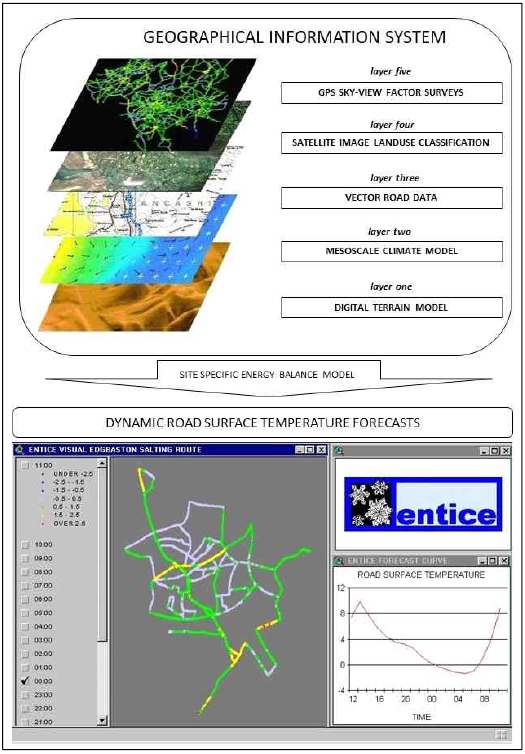
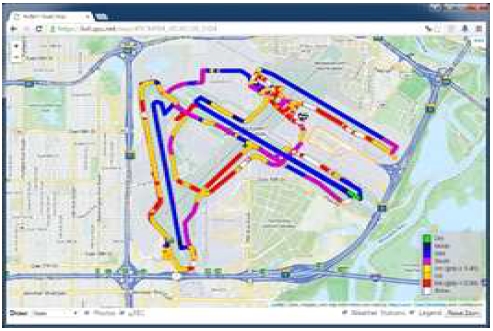
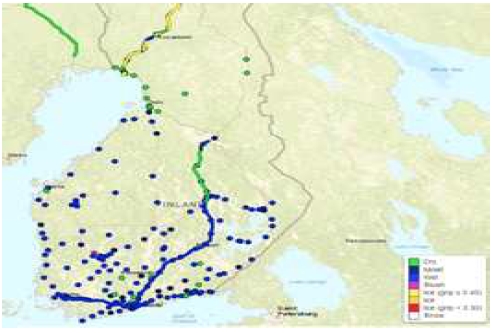
In Northern Denmark, a TMS was used to verify the performance of the Danish road weather model[16]. Previous research associated with TMSs has suggested that thermal mapping is a very useful tool for studying road weather, but it is necessary to define error rates and limitations. The Danish study confirms this[16]. Another study asserted that the data accuracy collected by TMSs was influenced by many systematic random errors[17]. It was found that the temperature difference in road surface of about 1.5℃ occurs in each lane, which directly affects the traffic heat fluxes. Teconer, a Finnish private company, developed the Road Condition Monitor that collects real-time information on road conditions in winter. For this purpose, TMSs were installed in 148 vehicles of the Finnish road management organization[18]. In the US, TMS equipment was installed and utilized in several states. Minneapolis, Minnesota has built a thermal map around its airport and utilized it well. In the UK, a GIS model combined with TMS was used to predict the road surface temperature in the West Midlands, and it was confirmed that the accuracy of prediction accounts for about 74% of spatial accuracy[19, 20].
Overall, TMSs are not only useful for current road surface temperature measurement and information collection for an entire road section, but also provide essential information for road surface prediction[21]. However, In Korea, the guidelines for the utilization of TMS, policy decision making based on TMS, and studies for predicting road surface temperature have not fully matured when compared to other countries.
2-2 Data Collection
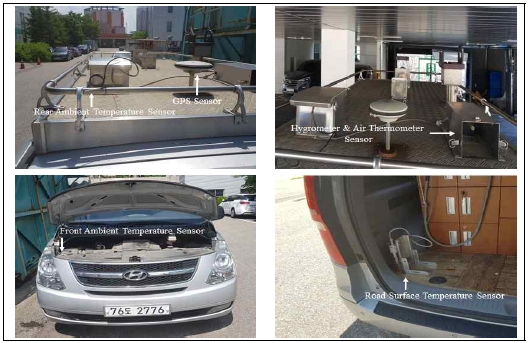
A TMS was installed on the survey vehicle to collect road surface temperature, vehicular ambient temperature (front and rear of the vehicle), atmospheric temperature, and humidity data. Figure 6 shows the TMS installed in the survey vehicle maintained by Korea Institute of Civil Engineering and Building Technology (KICT).
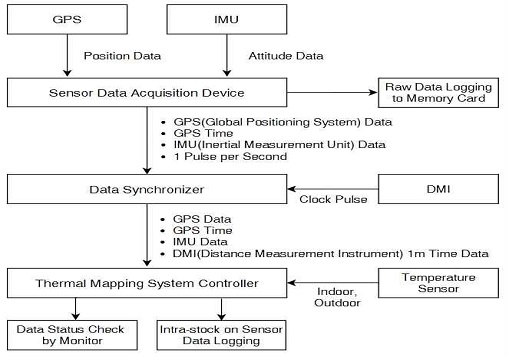
The KICT TMS consists of a power supply, a communication device for data transmission, an air temperature and humidity sensor, a road surface temperature sensor (using a non-contact infrared camera), and a GPS sensor combined with a computer and various software for displaying and storing data (see Figure 6). The data processing procedure and detailed specification of the TMS are presented in Figure 7 and Table 1, respectively.
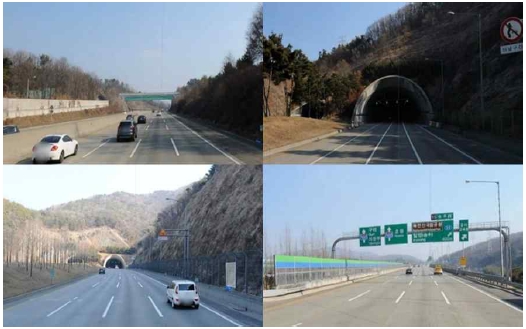
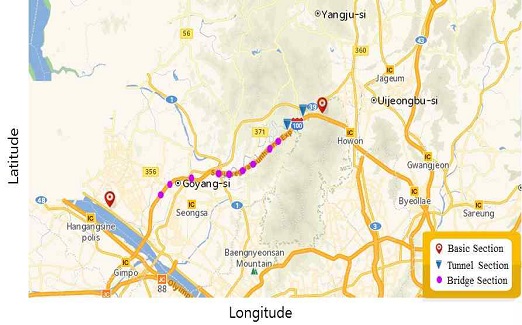
For this study, the 37.03km-section of Seoul outer-ring road was selected as the study area because it includes various road geometries and is known to experience frequent snowfall and road icing in winter. In particular, the study area includes tunnel and bridge sections that can directly or indirectly affect road surface freezing. The study area was classified into three types: normal section, bridge section, and tunnel section that affect the road surface temperature (see Figures 8 and 9).
The road surface temperature is the lowest just before sunrise. In this study, the data collection time was from 05:00 to 06:00. Data collection was performed during the same time intervals for the same survey interval every day.
Table 2 shows the attribute data, data format, and time period of each sensor included in the TMS.
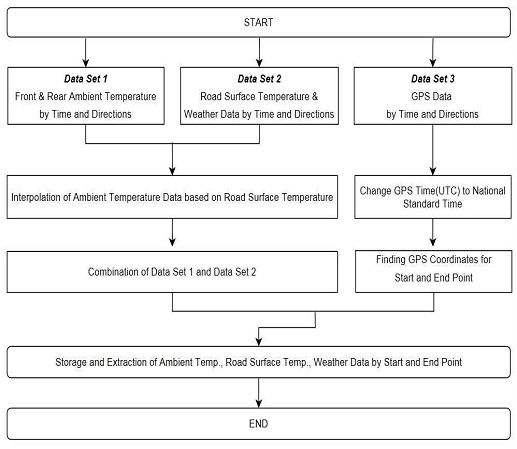
As shown in Table 2, the data collection cycle needs to be equalized because the GPS time is acquired at 1s intervals, the road surface temperature at 1s intervals, and the vehicular ambient temperature at 0.125 s intervals. In addition, it is necessary to convert GPS time to GPS coordinates. Therefore, a pre-processing procedure for the data collected through a TMS is required; this procedure is presented in Figure 10. The number of collected surface temperature datapoints is 4,665 in 2016 and 3,187 in 2017. The collected data was processed and converted into a database in a form that can be analyzed as follows (see Table 3).
Ⅲ. Results
The Pearson's correlation coefficient was used to statistically evaluate the correlation between data collected through the TMS. This method is frequently used in the fields of traffic engineering and traffic safety and has the advantage of quantitatively analyzing the relationships of data[22]. This method, however, does not explain the causal relationship but only the degree of association between the two variables. The Pearson correlation coefficient is given by
| (1) |
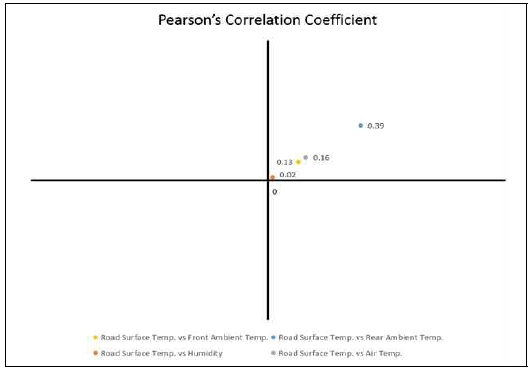
Where Rxy represents the correlation coefficient between variables x and y; and Sxy are the standard deviation of variables x and y; and indicates the covariance of variables x and y. If the correlation (Rxy) is between 0 and 1, it can be considered that there is a positive correlation, and if Rxy is between -1 and 0, it can be determined that there is a negative correlation; if Rxy is equal to 0, it can be regarded as no correlation between two variables. Pearson’s correlation coefficients of the front and rear of vehicular ambient temperature, the atmospheric humidity, and temperature were calculated based on the road surface temperature. The results are shown in Figure 11.
As shown in Figure 12, all the results of the Pearson correlation coefficients are positive, indicating a positive correlation between the road surface temperature and the variables that we considered. Humidity is associated with the presence or absence of weather precipitation. Because the temperature is lower during the day when it is raining, the relationship between humidity and road surface temperature can be expected to be negative. However, since there were no rainy days during the data collection and the correlation coefficient had a value close to 0, that relationship cannot be decided. When taking the absolute values of the four correlation variables, the rear outside temperature is seen to have the greatest influence on the road surface temperature followed by air temperature and vehicular ambient (front) temperature. It is noteworthy that the correlation coefficient between vehicular ambient (front) temperature and the road surface temperature is relatively low compared to the correlation coefficient between the atmospheric temperature and the road surface temperature. This is likely because vehicular ambient (front) temperature can be affected by the heat of the vehicle’s engine.
The statistical hypothesis test was also performed on the mean values of the front and rear of vehicular ambient temperature and road surface temperature for each road section to analyze the relationship between the road section, the road surface temperature, and the front and rear of vehicular ambient temperature.

Statistical hypothesis between the front and rear ambient temperature and road surface temperature by roadway sections
Table 5 shows the results of the second and third hypothesis tests conducted on the road surface temperature. It is statistically verified that the road surface temperature of the tunnel section is lower than the road surface temperature of the other sections. On the other hand, vehicular ambient temperature of the front and rear of the vehicle showed a similar temperature. As mentioned above, the bridge section cannot see temperature difference when compared to the tunnel section, and the same conclusion can be made based on the results of the hypothesis test.
However, it can be confirmed that the road surface temperature of the bridge section is lower than that of the normal section for some dates while the front and rear outside temperature of the vehicle are high. Therefore, the road surface temperature can be different depending on the type of road section.
Ⅳ. Discussion and Conclusions
Information on the change in road surface temperature in winter is very important not only for road agencies but also for general drivers. More precisely, information about the road surface condition such as dry, wet, and slushy is ultimately essential rather than the road surface temperature. We should know, however, that the road surface conditions are mainly dependent upon its temperature. In Europe and the United States, many studies on road surface temperature have been conducted, and currently the data associated with road surface temperature is collected, processed through various methods, and implemented in highway maintenance. In Korea, however, research on road surface temperature has not been active yet. In this study, we analyzed the statistical relationship of various data (road surface temperature, outside temperature of the vehicle, atmospheric temperature, and humidity) collected through a TMS. These can be considered necessary parameters for forecasting the road surface temperature.
There is a limit to generalizing the results of this study, but it is meaningful that we have tried basic research in the field of road weather using a TMS which is intended for operation by central or local government, or corporations in Korea. To elaborate on and rationalize the information on road surface temperature change patterns for the main arterial roads in the future, it is necessary to apply TMSs on different types of roads. In doing so, it will be possible to improve the operational efficiency of TMSs, to establish practical measures to improve snow removal operation, and to prepare preemptive measures against snow and black ice, which seriously threatens traffic safety in the winter season.
Acknowledgments
This work was supported by the Korea Agency for Infrastructure Technology Advancement (KAIA) grant funded by the Korea Government (MOLIT). (No.20POQW-B148886-03, Commercial Vehicle-Based Road and Traffic Information System)
References
-
A. Fujimoto, R. A. Tokunaga, M. Kiriishi, Y. Kawabata, N. Takahashi, T. Ishida, T. Fukuhara, “A Road Surface Freezing Model using Heat, Water and Salt balance and its Validation by Field Experiments”, Cold Regions Science and Technology, pp.106-107, 1-10, 2014.
[https://doi.org/10.1016/j.coldregions.2014.06.001]

-
C. Lee, K. Hedrick, K. Yi, “Real-time slip-based estimation of maximum tire-road friction coefficient”, IEEE/ASME Transactions on Mechatronics, Vol.9, pp.454-458, 2004.
[https://doi.org/10.1109/TMECH.2004.828622]

- FHWA. Road Weather Information System Environmental Sensor Station Siting Guidelines Version 1.0. Available online: https://ops.fhwa.dot.gov/publications/ess05/index.htm
- FHWA. Seasons of Achievement - Accomplishments of the Road Weather Management Program. Available online: https://transportationops.org/publications/seasons-achievement-%E2%80%93-accomplishments-road-weather-management-program
- FHWA. How Do Weather Events Impact Roads? – FHWA Road Weather Management. Available online: https://ops.fhwa.dot.gov/weather/q1_roadimpact.htm
-
A. W. Black, T. L. Mote, “Effects of winter precipitation on automobile collisions, injuries, and fatalities in the United States”, Journal of Transport Geography, Vol.48, pp.165–175, 2015.
[https://doi.org/10.1016/j.jtrangeo.2015.09.007]

-
L. Symons, A. Perry, “Predicting road hazards caused by rain, freezing rain and wet surfaces and the role of weather radar”, Meteorological Applications, Vol.4, pp.17–21, 1997.
[https://doi.org/10.1017/S1350482797000339]

-
M. Eriksson, J. Norrman, “Analysis of station locations in a road weather information system”, Meteorological Applications, Vol.8, pp.437-448, 2001.
[https://doi.org/10.1017/S1350482701004054]

- Caltrans Division of Research: Ensuring accuracy of roadway surface condition sensors, Preliminary Investigation, 2016.
-
L. Chapman, J. Thornes, A. V. Bradley, “Modelling of road surface temperature from a geographical parameter database”, Part 2: Numerical. Meteorological Applications, Vol.8, pp.421–436, 2001.
[https://doi.org/10.1017/S1350482701004042]

-
J. Shao, P. J. Lister, G. D. Hart, H. B. pearson, “Thermal mapping: reliability and repeatability”, Meteorological Applications, Vol.3, pp.325–330, 1996.
[https://doi.org/10.1002/met.5060030405]

- X. Shi, C. Strong, R. E. Larson, D. W. Kack, E. V. Cuelho, N. E. Ferradi, A. Seshadri, K. O’ Keefe, L. E. Fay: Vehicle-based Technologies for Winter Maintenance: The state of the Practice. 2000.
- Y. C. Kim, H. S. On, J. G. Lee, B. H. Kim, E. S. Choo, “A Study on the Relation of Road Topography Character and Road Surface Temperature using Thermal Mapping”, Korean Society of Civil Engineers Conference, South Korea, pp.1704-1709, 2003.
- C. H. Yang, M. S. Park, D. G. Yun, “A road surface temperature prediction modelling for road weather information system”, Journal of Korean Society of Transportation, Vol.29, pp.123–131, 2011.
- Korea Expressway Corporation: Studies on Establishing for Road Weather Information System of Freeway, 2010.
- Perry, Symons: Thermal mapping data for verification of the overall performance of the DMI-HIRLAM road weather modelling system, Danish Meteorological Institute, 1991.
-
T. Gustavsson, “Thermal mapping - a technique for road climatological studies”, Meteorological Applications, Vol.6, pp.385–394, 1999.
[https://doi.org/10.1017/S1350482799001334]

- TECONER. Available online: http://www.teconer.fi
- P. Saarikivi, “Development of mobile optical remote road condition monitoring in Finland”, Proceedings of the 16thSIRWECconference, HELSINKI, FINLAND, 2012.
-
L. Chapman, J. E. Thornes, “A geomatics-based road surface temperature prediction model”, Science of the total environment, Vol.360, pp.68-80, 2006.
[https://doi.org/10.1016/j.scitotenv.2005.08.025]

- Korea Institute of Construction and Building Technology: Developement of Driving Environment Observation, Prediciton, and Safety Technology based on Automotive Sensors, Annual Report, 2014.
- K. Molugarm, G. S. Rao, “Statistical Techniques for Transportation Engineering. BS Publications, 978-0-12-811555-8, 2017.

2008년 : Ph.D. in Civil Engineering at Univ. of California, Irvine
2002년 : 명지대학교 교통공학 석사
2000년 : 명지대학교 교통공학 학사
2009년~현 재: 한국건설기술연구원 인프라안전연구본부
차세대인프라연구센터 연구위원
KICT School 도시 및 교통시스템 공학 세부전공책임
※ 관심분야: 도로안전, 도로관리, 지하도로

2006년 : 관동대학교 교통공학 석사
2004년 : 강릉대학교 컴퓨터공학 학사
2015~현 재: 한국건설기술연구원 인프라안전연구본부
차세대인프라연구센터 전임연구원
※ 관심분야: 도로안전, 도로관리, 도로정보, 첨단교통
