Intelligent Emotional Recognition Using Biometric Information and Stress Index
Copyright ⓒ 2024 The Digital Contents Society
This is an Open Access article distributed under the terms of the Creative Commons Attribution Non-CommercialLicense(http://creativecommons.org/licenses/by-nc/3.0/) which permits unrestricted non-commercial use, distribution, and reproduction in any medium, provided the original work is properly cited.

Abstract
In this paper, input biometric values received from pulse sensor, blood pressure sensor, and blood glucose sensor were stored in the database, and emotions were classified according to the stress index using the Support Vector Machine (SVM) algorithm as a system that classifies the corresponding color and music by recognizing emotions according to the stress index after acquiring the user’s biometric information (blood sugar, diastolic blood pressure, systolic blood pressure, and pulse) through wireless sensors. The highest accuracy of 88.45% was obtained when the radial basis function (RBF) kernel parameter of the SVM algorithm using 3,000 datasets was set to σ = 5, C = 1 As a result of training, the average accuracy was calculated as 86.08%. The proposed bio-emotion recognition classification system using the SVM algorithm is expected to contribute to the research in user–computer emotional exchange by means of smart classification of colors and music based on the user's emotions.
초록
본 논문은 사용자의 생체 정보(혈당, 이완기 혈압, 수축기 혈압, 맥박)를 무선 센서들을 통해 생체 정보를 획득한 후 스트레스 지수에 따른 감성을 인식하여 대응되는 컬러와 음악을 분류하는 시스템으로써, 혈당 센서, 혈압 센서, 맥박 센서 등의 입력치를 받아 데이터베이스에 저장한 후 SVM(Support Vector Machine) 알고리즘을 이용하여 스트레스 지수에 따른 감성을 분류하고자 하였다. 4,000개의 데이터 집합을 사용하여 SVM 알고리즘의 RBF 커널 파라미터가 σ = 5, C = 1로 설정되었을 때 88.45%의 최고 정확도를 보였으며 학습한 결과 평균 86.08%의 정확도를 가졌다. 제안한 SVM 알고리즘을 이용한 생체 감성 인식 분류 시스템은 사용자의 감성에 따라 지능형으로 컬러와 음악을 분류함으로써 사용자와의 컴퓨터 간의 감정교류 연구에 도움이 될 것으로 기대한다.
Keywords:
Biometric Information, Stress Index, SVM Algorithm, Emotion Modeling, Biometric Emotion Recognition키워드:
생체 정보, 스트레스 지수, SVM 알고리즘, 감성 모델링, 생체 감성 인식Ⅰ. Introduction
Recent development of science and technology has changed human life and way of thinking, with most systems automated and enabled to communicate humans. One of the technologies required at this juncture of time is emotion information processing technology for emotional exchange with users [1]-[3].
Emotion recognition technology is a smart decision-making method of user recognition based on emotion information and capable of taking appropriate actions by extracting information from various facial expressions, gestures, and movements. As such, more efficient human-computer interaction is possible by equipping the computer with the emotional recognition ability to process human emotions through learning and adaptation. Among various types of emotion information, color and music, which are visual and auditory information, respectively, play a very important role in understanding and interpreting human emotions because they are formed in a short time and linger in memory for a long time [4].
This study aims to classify the bio-emotions for the recognition of user’s emotions by learning and patterning the reactions manifested depending on individual emotions and matches them to the stress index [5]. For emotion classification, biometric data are obtained using a variety of sensors (blood sugar, systolic blood pressure, diastolic blood pressure, pulse), and emotion information matched with the stress index is classified using the SVM algorithm. Although there are a range of learning algorithms that can be generally applied to decision support systems, an SVM algorithm was used because the datasets used in this study (blood sugar, blood pressure, pulse, and stress index data) have nonlinear data structure.
In the case of nonlinear data, the SVM algorithm, which is applied to solve nonlinear discrimination problems with a multi-layer perceptron structure for solving discrimination problems, is easier to interpret the results compared to other neural networks, and can perform discrimination learning quickly with a small amount of training data. Not only does it possess a strong predictive power similar to that of artificial neural networks (ANN), it can also reduce the limitations typical of ANN, such as overfitting and minimal optimization [6]. The classified stress emotion is matched with emotion color and music, followed by data classification in accordance with the corresponding color and music values.
In this paper, input biometric values received from pulse sensor, blood pressure sensor, and blood glucose sensor were stored in the database, and emotions were classified according to the stress index using the Support Vector Machine (SVM) algorithm as a system that classifies the corresponding color and music by recognizing emotions according to the stress index after acquiring the user’s biometric information (blood sugar, diastolic blood pressure, systolic blood pressure, and pulse) through wireless sensors.
Ⅱ. Experiment Design
In this paper, the emotion information matched with the stress index is classified using the SVM algorithm after acquiring biometric data using various sensors for emotion classification.
The classified emotions are classified into color values matching the emotions classified according to the 20-color emotion models set by HP’s “The Meaning of Color.” Since emotional music has different emotions and moods and shows mood-dependent variations, classical music pieces were collected, classified, and utilized based on the music therapy data. Music-related contents were composed based on data collected as for music therapy data presented by “Samsung Idea” [7]-[8].
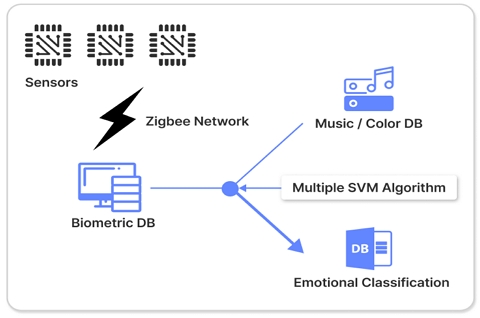
The biometric emotional recognition system based on stress index proposed in this paper consists of an integrated module, XBee wireless communication, standardized biometric database, emotional color/emotional music database, and emotional classification database. To sense the user's biometric information, an integrated module measures biosignals using pulse, blood pressure(Diastolic, Systolic), and blood sugar sensors. After connecting to a PC through XBee wireless communication, the measured data was transmitted to a standardized database. A sensor module integrating pulse, blood pressure (Diastolic, Systolic), and blood sugar sensors was used, and a total of 10 sensor nodes, including 1 sink node, were used. After storing stream data and processing queries on it, it is stored in the database, and the stored data is classified through the SVM algorithm. Afterwards, the matched emotional information (corresponding emotional color and emotional music) was classified according to the stress index defined in this paper.
To evaluate the performance of the system, biometric data was measured using a wireless sensor based on 20 healthy adults in their mid-20s as experimental data. To proceed with learning, the data was classified into training data and test data. The classification standard was 7:3 to classify training data and test data, and the classification selection criteria were set randomly.
Fig. 1 is a block diagram of the emotion classification system based on the stress index using the biometric data acquired through various sensors.
A Zigbee wireless sensor network system was implemented for the measurement of the user’s bio-signals. IEEE 802.15.4 Zigbee is a short-range wireless communication technology primarily used for applications requiring low speed, low cost, and low power consumption. In the experiment of this study, an integrative sensor module combining the pulse, blood pressure, and blood glucose sensors was used. As the processor board for system configuration, MCU and CC2431 Radio Chip (MSP430, Telos platform series) were used [9].
If a separate packet is made for each of the blood sugar, systolic blood pressure, diastolic blood pressure, and pulse values, data transmission requires additional traffic and energy consumption. Therefore, they were bundled together as one packet for transmission to the database and the five input data (systolic blood pressure, diastolic blood pressure, fasting blood sugar, and two-hour blood sugar) were arranged to be transmitted from each sensor.
2-1 Biometric Data Measurement
Fig. 2 shows the structure of the sensed biometric data. The MSG type detects the type of biometric data among pulse, systolic blood pressure, diastolic blood pressure, and blood sugar. GroupID represents sensor information, whereby each sensor has one GroupID. Timestamp is the time of data measurement by the sensor. Reading is the incoming data value expressed as in hexadecimal 2 bytes.
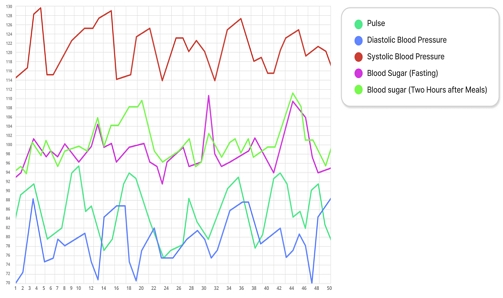
Fig. 3 shows the graphs representing the measured pulse, systolic blood pressure, diastolic blood pressure, fasting blood sugar, and two-hour blood sugar data.
2-2 SVM Algorithm
Although various learning algorithms are available for matching biometric data with stress index, an SVM algorithm was used for the data used in this study, i.e., pulse, blood pressure, and blood glucose data, which have nonlinear data structure. SVM algorithm can solve nonlinear discrimination problems with multi-layer perceptron structure is used, and SVM classification is a method to find a classification hyperplane that separates two groups well [10].
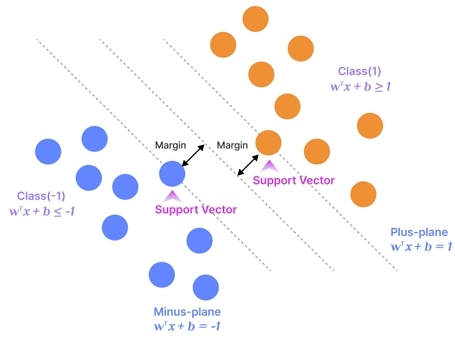
SVMs have scalability superior to that of existing linear classification methodologies and show consistently excellent performance unlike the neural network classification method, whose performance fluctuates at each training session. The basic principle of SVM starts with a problem that can be linearly separated. It considers the problem that is divided into binary values, such as -1 and +1 as the output values of the training data when the input data Xi is given in the d- dimension [11]-[12].
In order to define a model for classifying two sets, a hyperplane, a linear identification function as shown in Fig. 4, can be defined. Here, “support vector” means a sample closely related to the boundary that determines the classification rule.
Linearly inseparable data, as is the case with the data used in this paper, are made amenable for linear classification by the nonlinear mapping Φ, which transforms the input vector into a dimension that allows linear classification higher than that of the input vector.
When several conditions are satisfied, there is a high probability that a problem that is linearly inseparable in the input space will be converted to a linearly separable problem in a high-dimensional feature space to which nonlinear mapping is applied. Although it results in an increase in computational cost due to mapping into a high-dimensional space. This problem can be solved with the kernel function.
The nonlinear mapping converts the data points in the N-dimensional input space into a higher dimensional feature space (Q-dimensional) using the kernel function, making the data points linearly distinguishable. Equation (1) is a kernel function and a decision function.
| (1) |
Equation (1) means that if the feature mapping Φ is appropriately selected, the inner product in the feature space is the same as the kernel in the input space, so there is no need to calculate it in a high-dimensional feature space, thereby reducing the increase in computation.
Instead of simply finding the classification plane or minimizing the sample error, SVM maximizes classification accuracy for new data by maximizing the classification margin [13].
Since SVM was developed for binary classification, it encounters challenging situations in real-life environments when solving problems with multiple classes. To address these problems, the one-against-all and the one-against-one techniques have been proposed.
In the one-against-one technique, which consists of k(k-1)/2 SVMs when k classes are entered, each training dataset consists of data points from only two affiliations and the size of the training dataset is small, which allows a rapid learning.
The experiment in this paper was performed using the one-against-one technique in an attempt to improve the learning performance, and an SVM algorithm was constructed as shown in Fig. 5.
In this paper, a neural network with two level output layers was constructed to process biometric data using four input data (pulse, systolic blood pressure, diastolic blood pressure, and blood sugar).
- 1) The number of nodes in the input layer must be 4, which is the number of each data item.
- 2) The output layer corresponds to Level 1 if the first node is selected based on the weight learned through the input data.
- 3) The number of nodes in the hidden layer is 1 or more. As the number of hidden layers increases, the learning time increases, so it is important to determine the appropriate number of hidden layers.
The proposed SVM algorithm creates a hyperplane with a maximum margin for each feature of the given training dataset. In the test stage, it performs mapping in the multidimensional space divided by the hyperplane generated in the training stage in order to classify new data.
2-3 Emotional Color & Music Matching
Given the diversity of the types of emotions that can be expressed in response to the external environment, it is effective to predefine the emotion color and sound sources to be used. In this paper, the 20-color emotion models set by HP’s “The Meaning of Color” were selected as representative elements for the classification of emotion colors.
A close look at the HP color table and the results of matching the emotional vocabulary extracted from the survey in this paper, a set of common emotional vocabulary could be found, which could be classified as shown in Table 1.
Color and sound, which are important emotional information to understand and grasp emotion, have the common characteristic of waves. That is, waves provide a fundamental clue to connect color and sound. Wavelength and frequency are mathematically interconvertible physical quantities in inverse proportion to physics and mathematically. Based on Do, the wavelength relationship between Mi and Sol is 4/5 and 2/3, and the wavelength ratio is 1:4/5:2/3. This ratio corresponds to the wavelength ratios of 650nm, 520nm, and 433nm respectively of the three primary colors red, green, and blue.
Do, Mi, and Sol are very similar to the three primary colors from which a vast variety of colors can be created by appropriately mixing red, green, and blue light. Therefore, if the wavelength ratio of the 12-tone equal temperament scale is sequentially matched with the colors that can be created by the combination of the three primary colors, music and color can be connected.
The wavelength ratio of the seven tones within an octave is 1 : 8/9 : 4/5 : 2/3 : 3/5 : 8/15 : 1/2. By compensating for the non-uniformity of the pure wavelength ratio of Do-Re-Ri-Fa-Sol-La-Ti-Do (including the Do of the next octave), the wavelength ratio between each tone of the 12-tone equal temperament scale is calculated at 1:1.0594. This demonstrates that the color frequencies of the 12 points forming the color wheel are matched to the wavelength ratio of the 12-tone equal temperament scale [14].
The optimal sound source matching list is determined by analyzing the data inferred by matching the results of analysis of the color measurement value and the scale of the sound source used as an indicator. It was composed based on the data and classified into 5 types of emotions according to the stress index. Data collected based on the music therapy resources presented by “Samsung Idea” were used to classify the five emotions according to the stress index.
Table 2 presents well-matched emotion colors and emotion music pieces designed to change the user’s stress mood. When the stress index is between 0 and 30, which is the range for level 1, the corresponding emotion, emotion color, and emotion music are guideline, red, and Vivaldi’s Four Seasons-Spring and 10 other pieces, respectively.
Ⅲ. Performance Evaluation and Experimental Results
In this paper, three wireless sensors (blood sugar, systolic blood pressure, diastolic blood pressure, and pulse) were placed for the experiment on biometric recognition. Emotion classification was conducted after matching the biometric dataset, which consists of over 4,000 fasting blood sugar, two-hour blood sugar, systolic blood pressure, diastolic blood pressure, and pulse data points obtained from the sensors, with the stress index.
As shown in Table 3, stress index-based data classification criteria for biometric recognition were clustered into 5 states according to the stress level. To minimize the influence from the training data and ensure reliability, 10-fold cross-validation was performed on the experimental results. The experimental data set was divided into the subsets of evaluation data and verification data at a ratio of 7:3, and the system was optimized using the leave-one-out technique. Further, the classification accuracy of the training dataset was measured using 10-fold cross-validation while adjusting the kernel parameters of the four kernels representative of the SVM as well as C, the error tolerance cutoff value. In the 10-fold cross-validation, one dataset is separated into 10 equal parts, with one them used as testing data and the remaining nine parts as training data. Based on the experimental results, the SVM algorithm set as the optimal parameter was selected.
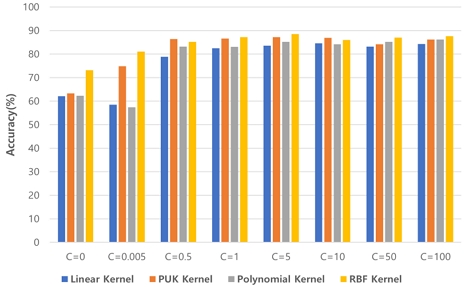
As the kernel of the SVM algorithm, a linear kernel, Pearson Universal Kernel (PUK), polynomial kernel, and Radial Base Function (RBF) kernel are generally used. The experiment was performed while varying the kernel parameters of each kernel used for the SVM algorithm and the error cutoff C value. The C value was uniformly varied for each kernel as follows: 0, 0.005, 0.5, 1, 5, 10, 50, and 100. Table 3 presents the C-dependent kernel parameter values for each kernel.
The SVM algorithm set with the optimal parameters was selected based on the experimental results, and its performance was compared with other machine learning algorithms. For performance evaluation, training data and test data were divided at the ratio of 9 to 1 using 10-fold cross-validation, and accuracy was used as a measure of performance. Equation (2) represents the accuracy, where TP stands for true positive, FN false negative, TN true negative, and FP false positive.
| (2) |
Fig. 6 plots the accuracy of the SVM algorithm as checked against the C value under the condition of optimal configuration of the parameters of each kernel. Experimental results revealed the highest accuracy of 88.45% when the RBF kernel parameters were set to σ = 5, C = 1. Accordingly, it was selected as the optimal SVM algorithm.
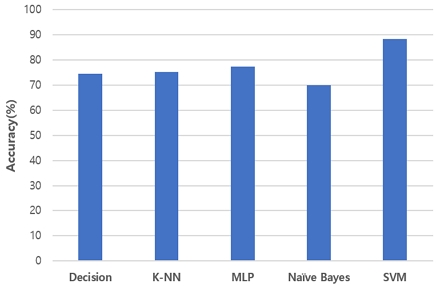
For comparison purposes, other machine learning algorithms similar to the SVM algorithm were also tested under the optimal parameters, which resulted in the accuracy levels of 74.47%, 75.17%, 77.48%, 70.02%, and 88.45% for Decision Tree, NaïveBayes, SVM, K-NN, and MLP algorithm, respectively, as shown in Fig. 7. These testing results demonstrate the superiority of the SVM algorithm set under the optimal parameter conditions to comparable algorithms, at least 5% more accurate than other machine learning algorithms. With the average accuracy of the proposed SVM algorithm amounting to 86.08%, the matching accuracy, the matching accuracy of each biometric data with stress was proved to be very high.
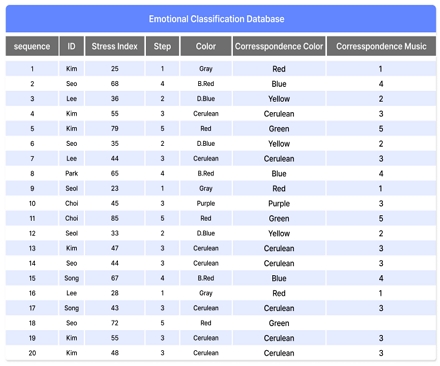
Fig. 8 is the emotion classification database in which colors and music matched with the bio-emotions associated with the stress index are classified. The classification database is divided into items for the stress index and emotion colors and emotion music to be matched according to the stress index.
Ⅳ. Conclusions
In this paper, it was attempted to classify colors and music attuned to the user’s emotions by recognizing biometric data. Colors and music were classified according to the user’s current emotion identified through real-time analysis of blood sugar, systolic blood pressure, diastolic blood pressure, pulse, and stress data.
For performance test, linear kernel, Pearson Universal Kernel (PUK), polynomial kernel, and Radial Base Function (RBF) kernel were used. The experiment was performed while varying the kernel parameters of each kernel used for the SVM algorithm and the error cutoff C value. Since the experimental results revealed the highest accuracy of 88.45% with the RBF kernel parameters, it was selected as the optimal SVM algorithm. Furthermore, other machine learning algorithms similar to the SVM algorithm were also tested under the optimal parameters for comparison purposes. As a result, the SVM algorithm configured under the optimal parameter conditions proved itself superior to comparable machine learning algorithms, at least 5% more accurate than other algorithms. With the average accuracy of the proposed SVM algorithm amounting to 86.08%, the matching accuracy each biometric data with stress was proved to be very high. The proposed bio-emotion recognition classification system using the SVM algorithm is expected to contribute to the study of user–computer emotional exchange by means of smart classification of colors and music based on the user's emotions.
Acknowledgments
This research was supported by the Project for Practical Use of Regional Science and Technology Performance of the Commercialization Promotion Agency for R&D Outcomes(COMPA) funded by the Ministry of Science & ICT(1711198118, Chosun University).
References
-
J. Jeong and M. Whang, “Handling Real-time Location-based Emotion Information for Emotion Data Service,” Journal of Next-generation Convergence Information Services Technology, Vol. 8, No. 3, pp. 253-262, September 2019.
[https://doi.org/10.29056/jncist.2019.09.03]

-
C. Jo and H. Jung, “Multimodal Emotion Recognition System Using Face Images and Multidimensional Emotion-Based Text,” Journal of KIIT, Vol. 21, No. 5, pp. 39-47, May 2023.
[https://doi.org/10.14801/jkiit.2023.21.5.39]

-
Y. J. Lee, “Artificial Intelligence Immersion Enhancement Technology using Human Emotion Information and Body Information in the Coexistence Space of Virtual and Real,” Journal of KIIT, Vol. 20, No. 9, pp. 125-136, September 2022.
[https://doi.org/10.14801/jkiit.2022.20.9.125]

-
T. G. Lee, H. R. Uhm, C. Y. Jeong, and C.-K. Kim, “Generating Emotional Face Images using Audio Information for Sensory Substitution,” Journal of Korea Multimedia Society, Vol. 26, No. 3, pp. 465-471, March 2023.
[https://doi.org/10.9717/kmms.2023.26.3.465]

-
T.-Y. Kim, “A Study on Intelligent Emotional Recommendation System Using Biological Information,” The Journal of Korea Institute of Information, Electronics, and Communication Technology, Vol. 14, No. 3, pp. 215-222, June 2021.
[https://doi.org/10.17661/jkiiect.2021.14.3.215]

- R. M. Balabin and E. I. Lomakina, “Support Vector Machine Regression (SVR/LS-SVM)—An Alternative to Neural Networks (ANN) for Analytical Chemistry? Comparison of Nonlinear Methods on Near Infrared (NIR) Spectroscopy Data,” Analyst, Vol. 136, No. 8, pp. 1703-1712, February 2011.
-
T.-Y. Kim, H. Ko, S.-H. Kim and H.-D. Kim, “Modeling of Recommendation System Based on Emotional Information and Collaborative Filtering,” Sensors, Vol. 21, No. 6, 1997, March 2021.
[https://doi.org/10.3390/s21061997]

-
J.-J. Park, “A Development of Chatbot for Emotional Stress Recognition and Management Using NLP,” The Transactions of the Korean Institute of Electrical Engineers, Vol. 67, No. 7, pp. 954-961, July 2018.
[https://doi.org/10.5370/KIEE.2018.67.7.954]

-
X. Guo, Y. He, Y. Liu, and L. Shangguan, “A New Design Paradigm for Polymorphic Backscatter Radios,” GetMobile: Mobile Computing and Communications, Vol. 27. No. 3, pp. 18-22, September 2023.
[https://doi.org/10.1145/3631588.3631594]

-
T.-Y. Kim, S.-H. Bae, and Y.-E. An, “Design of Smart Home Implementation within IoT Natural Language Interface,” IEEE Access, Vol. 8, pp. 84929-84949, May 2020.
[https://doi.org/10.1109/ACCESS.2020.2992512]

-
Y. Tarabalka, M. Fauvel, J. Chanussot, and J. A. Benediktsson, “SVM- and MRF-Based Method for Accurate Classification of Hyperspectral Images,” IEEE Geoscience and Remote Sensing Letters, Vol. 7, No. 4, pp. 736-740, October 2010.
[https://doi.org/10.1109/LGRS.2010.2047711]

-
H. Lee, D. Shin, and D. Shin, “The Classification Algorithm of Users’ Emotion Using Brain-Wave,” The Journal of Korean Institute of Communications and Information Sciences, Vol. 39C, No. 2, pp. 122-129, February 2014.
[https://doi.org/10.7840/kics.2014.39C.2.122]

-
C.-H. Hwang, G.-Y. Shin, D.-W. Kim, and M.-M. Han, “Compiler Analysis Framework Using SVM-Based Genetic Algorithm: Feature and Model Selection Sensitivity,” Journal of the Korea Institute of Information Security & Cryptology, Vol. 30, No. 4, pp. 537-544, August 2020.
[https://doi.org/10.13089/JKIISC.2020.30.4.537]

-
S.-I. Kim and J.-S. Jung, “A Basic Study on the System of Converting Color Image into Sound,” Journal of Korean Institute of Intelligent Systems, Vol. 20, No. 2, pp. 251-256, April 2010.
[https://doi.org/10.5391/JKIIS.2010.20.2.251]

저자소개

2003년:조선대학교 일반대학원 전산통계(이학석사)
2015년:조선대학교 일반대학원 전산통계(이학박사)
2012년~2015년: 신한시스템즈(주) 연구소장
2012년~2017년: 광주보건대학교 겸임교수
2018년~2022년: 조선대학교 SW중심대학사업단 조교수
2023년~현 재: 조선대학교 과학기술정책융합사업단 연구원
※관심분야:AI, Big Data, Emotion Technology, Iot

2012년:호남대학교 일반대학원 호텔관광학과(경영학석사)
2019년:호남대학교 일반대학원 호텔관광학과(경영학박사)
2011년~2017년: ㈜마실코리아 대표이사
2012년~현 재: (재)지역문화교류호남재단 이사
2016년~현 재: (사)한국클라우드센트럴파크 교육분과위원 부회장
2017년~2022년: 조선대학교 SW중심대학사업단 산학협력중점교수
2023년~2024년: 조선대학교 LINC3.0사업단 산학협력중점교수
2024년~현 재: 조선대학교 SW중심대학사업단 산학협력중점교수
※관심분야:Biometrics, Big Data, VR/AR, Sensor Data Processing
