Application of the integrated land use transport models on a tram project in South Korea
Copyright ⓒ 2020 The Digital Contents Society
This is an Open Access article distributed under the terms of the Creative Commons Attribution Non-CommercialLicense(http://creativecommons.org/licenses/by-nc/3.0/) which permits unrestricted non-commercial use, distribution, and reproduction in any medium, provided the original work is properly cited.

Abstract
It is known that tram, a type of light rail transit (LRT) has positive impacts such as improving travel mobility and accessibility, revitalizing business areas adjacent to tram lines, and enabling pedestrian-oriented roads. The city of Suwon in Korea plans to install a 6 km long tram line in the downtown area. The authors applied an integrated land use transport model to examine various impacts of the adoption of the tram. The Business As Usual (BAU) scenario and a tram adoption scenario were simulated using this model. Future land uses and traffic patterns of the two scenarios were predicted and compared. From the analysis results, it was found that housing demand was moved from downtown to outskirts and land use for office and service near tram route increased. As a result, it was predicted that CO2 are about 15,786 tons less emitted in 2030, which is 0.32% decrease compared to the sum of BAU scenarios.
초록
경전철 (LRT)의 일종인 트램은 이동성과 접근성을 개선하고, 사업영향권역에 대한 보행자 중심의 상업 및 업무시설을 활성화하는 등 긍정적인 영향을 미치는 것으로 알려져 있다. 수원시는 도심 6km 구간을 대상으로 트램노선을 설치할 계획을 발표하였다. 따라서 본 연구에서는 토지이용-교통 통합 모형을 활용하여 트램 도입에 따른 다양한 영향분석을 수행하였다. 먼저, 모델을 기반으로 BAU (Business As Usual) 시나리오와 트램 채택 시나리오에 대한 시뮬레이션을 통해 두 시나리오의 향후 토지 이용과 교통 패턴을 예측하고 비교하였다. 분석결과, 주택 수요가 도심에서 외곽으로 이동하였으며 트램노선 인근에서는 상업업무시설의 토지 사용이 증가한 것으로 나타났다. 최종적으로 2030년까지 전체 CO2 배출량은 약 15,786톤으로 BAU 시나리오 합계에 비해 0.32% 감소할 것으로 예측되었다.
Keywords:
Integrated land use transport model, CO2 emissions, Air pollutions, Policy evaluation, Tram키워드:
토지이용-교통 통합 모형, 이산화탄소 배출량, 대기오염, 정책평가, 트램Ⅰ. Introduction
A public transportation is recognized as an effective solution to mitigate traffic congestion as well as to reduce CO2 and air pollutants in urban areas. Thus, many cities around the world have been making efforts to expand and improve their public transportation systems including buses, subways, and trains. Recently, Light Rail Transit (LRT) have been adopted as mass transit system options[1], [2], [3]. It is also known that LRT has positive effects on the revitalization of adjacent business areas around LRT routes and the rehabilitation of urban area[4].
Recently, Trams, a type of LRT became a more attractive option by introducing wireless trams with wireless charging technology. Operation of trams promotes pedestrian-oriented by limiting or prohibiting vehicle trips in the vicinity of tram line. Tram provides more reliable service than buses in congested city center. Also, it can be a tourist attraction. Old tram lines built in South Korea between late 19th century and early 20th century were all removed around 1968 due to the increase of vehicle traffic inside the urban area. However, tram reintroduction was recently proposed as an alternative solution to subway which has very high costs and considerable time to build. Daejeon Metropolitan City and Wirye New Town have plans to construct tram routes. The City of Suwon also has a plan to adopt a tram system in order to shift their urban transportation policy paradigm from car to pedestrian-oriented and environmental friendly[5].
In order to introduce a tram system into an existing urban area, a study on the feasibility of installation, along with getting stakeholders agreement is in necessary. As a rule, cost-benefit analyses have been used for evaluating investments of transportation facilities. However, considering benefits from changes in travel demand and traffic flow which are examined by a cost-benefit analysis are not sufficient to explain other impacts of trams in a city. This is because other factors such as revitalization of adjacent business districts and relocation of the residential area are not considered. Also, the limitation of economic analysis is often reported, is the existence of significant difference between predicted and actual demand after the transportation system is installed and operated[6], [7], [8], [9]. The inaccuracy in estimating the travel demand is explained by various reasons[8]. One of the main reasons is the fact that land use and residents’ lifestyle affected by changes in the transportation system are not well considered.
In this study, the effects of operating a 6 km long tram line in downtown of Suwon, which will be inaugurated from 2017 were analyzed. In order to consider impacts on land use change as well as trip change by the tram operation, an integrated land use transport model was applied. The model has the capability of predicting changes in future land uses and traffic patterns by considering the interaction between land use and transportation. Land use change includes change of locations of preferred residential areas, offices and business districts. Also, environmental impacts such as reduction in CO2 and air pollutant emissions were estimated to check how much the adoption of tram contributes to achieve the goal of the Suwon’s new transportation policy paradigm.
This paper begins by describing research method including selection of an appropriate integrated land use transport model, analysis framework, and modeling process, and then describes how to analyze the effect of tram in Suwon. Finally, the analysis results in terms of land use, transportation, and environment, and implications are laid out.
Ⅱ. Method
2-1 Selection of integrated land use transport model
The cost-benefit analysis results for Suwon tram case yield of cost-benefit ratio of 0.84[10]. A debate about the justification of investment in a tram route construction would have taken place based on only considering economic analysis results. However, urban planners and policy makers in Suwon were determined to look for another approach. The authors selected an integrated land use transport model to deal with their need.
Integrated land use transport models such as ILUTE[11], TLUMIP[12], ALBATROSS[13], PUMA[14] and IRPUD[15], and PROPOLIS[16] were suggested to predict broader changes in the urban landscape. One main feature of this model is that the distribution of land use and traffic are strongly connected. The land use model generates a set of matrices of potential transport demand, and the transport model transforms potential demand into actual trips. Finally, demand is assigned to the transport model supply options.
In this study, combination of DELTA[17] and OmniTrans[18] were selected and applied to estimate the future land use change and traffic pattern. There are three main reasons for selecting this model combination in this study. 1) DELTA is applied in many European cities 2) OmniTrans has an edge in modeling multi-modal networks and successful integration is feasible between the two models 3) some fundamental researches have performed in Korea[19], [20].
Fig. 1 gives an overview of the combination of DELTA and OmniTrans. DELTA predicted changes in population, employment, and land use relocation. DELTA does not model transport but depends on the interaction with a transport model. One of the important factors in assessing relocation conditions in the land use model is accessibility, which is calculated based on the traffic analysis results from the transport model. The land use model analyzes factors for affecting travel demand depending on the land use and sends those to the transport model. OmniTrans estimates changes in travel pattern and traffic conditions. By iterating model runs and this interaction process, the integrated model predicts more realistic changes of the city.
2-2 Analysis Framework
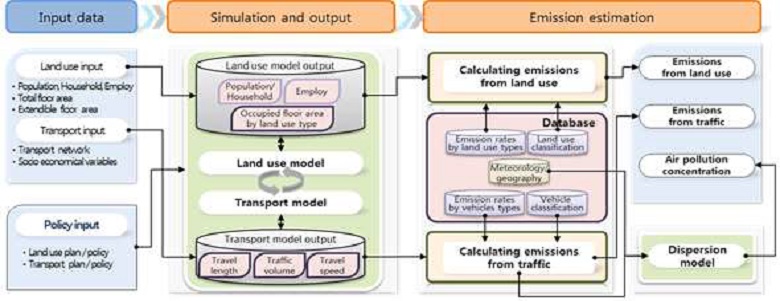
The method was applied in this study and the overall analysis procedure is shown in Fig. 2. An integrated land use transport model is the main simulation model to analyze the effects of transportation policies and land use strategies in a certain city. Urban environmental impact can be estimated using the simulation predictions. The first step was to collect a wide variety of input data for both land use and transport model and run the simulation. The second, the model provides predictions of future land use and transportation. Then, CO2 emissions from land use are calculated by multiplying the occupied floor area by land use type with the emission factor by land use type. CO2 and other air pollutant emissions are calculated by multiplying the traffic volume and link length with the emission factors by vehicle type and vehicle speed. Air pollution concentration is estimated based on the vehicle’s air pollutant emissions using a dispersion model such as CALINE. Weather and topography data for Suwon were used as inputs, Analysis was performed in lattice unit (1km by 1km).
Ⅲ. Application Study
3-1 The geographic boundary of the Study Area
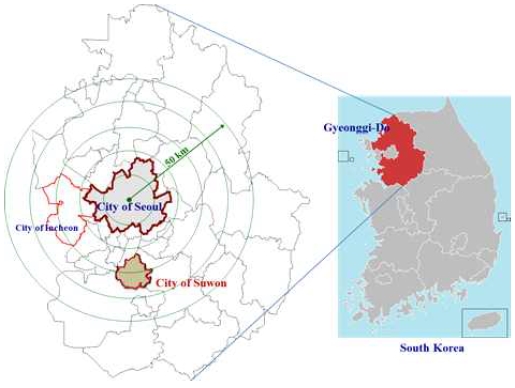
Case study is for analyzing impacts of operating a 6 km long tram line in Suwon, Korea. Modeled area is the Seoul Metropolitan Area (SMA) which includes a direct affected city, Suwon and indirect affected cities near Suwon. Fig. 3 shows the location of Suwon in the SMA. The SMA consists of Seoul, Incheon, and Gyeonggi-Do. Suwon is one of the cities in Gyeonggi-Do. By Statistics Korea[21], about 24.9 million people are living in SMA and almost half of all Koreans are living in this area. About 12 million people (24.1%) live in Gyeonggi-Do.
By the Suwon Statistics[22], the population of Suwon is 1.2 million totaling 10% of Gyeonggi-Do. Population density of SMA is about 2,106 people per km2. As the statistics show, SMA is a very congested area and has severe traffic congestion. The total length of roads of Suwon is approximately 889km, while its railway network is only 17 km long, which means the city heavily relies on road transportation[5]. A high dependence on buses contributes high congestion in the downtown area.
3-2 Analysis scenarios and model inputs
Business as usual (BAU) scenario represents the case that we live following current life style. To build a BAU scenario for the land use transport integrated model, most recent data about the study area need to be collected. In this study, most of required data were acquired from 2010 data. The land use model, Delta requires various information regarding household data such as demographics, socio economic data, spatial information, car ownership, distance between traffic zones, travel patterns, and so on. Input data for the transportation model, Omnitrans are transport network data, travel OD, socioeconomic data. Korea Transportation Network Database[23] provides transportation network data and trip related properties. Input data are comprised of shape files and attributes such as nodes, centroids, roads, and urban railways. Routes and operating information of urban railway and buses were collected and entered as input data.
In the BAU scenario, urban policies and their strategies that were confirmed to be implemented were reflected in the designated year. Confirmed land use development, redevelopment, regeneration, urban improvement plan in the study area from 2010 to 2030 were investigated. Table 1 summarizes changes in possible floor area according to the confirmed plans. Because of uncertainty, plans between 2020 and 2030 are excluded. Minus values in the table represent relocations before redevelopment. Road construction plans until 2015 and until 2020 were investigated and reflected. Table 2 shows additional road length (km) by road construction plans. Suwon has already heavily relies on road transportation, there is no significant road construction plans in Suwon.
Alternative scenario is the case that includes any treat for some purposes. After the BAU scenario is built through the procedure of data input and model calibration and validation, the alternative scenario is made by applying the alternative to the BAU scenario. The alternative scenario is relatively easy to establish once the BAU scenario is developed. Various alternatives can be made by combination of various policies and by considering different implementation timings.
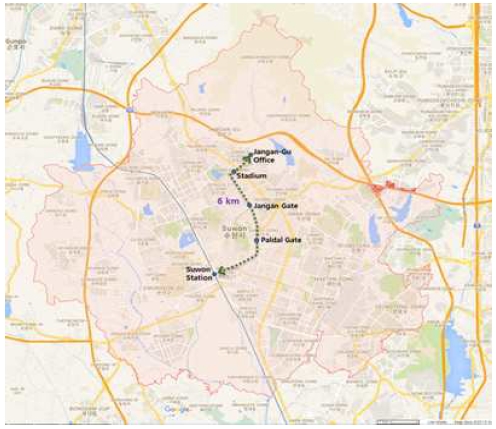
Suwon is considering the adoption of a tram route shown in Fig. 4. The target year for opening the line is in 2017, starting from Suwon Station and connecting to Paldalmun, Janganmun, Suwon sports complex, and Jangan-Gu office. The route passes through major tourist attractions including Hwaseong, an old royal palace. Because the tram will be connected with a main subway line and a train line at the Suwon station, it is expected to improve accessibility to these stations from the outer areas of Suwon. In addition, regeneration of the old downtown and revitalization of business districts around the tram line are highly expected.
The location of 6 km route, operating capacity, and operating schedule of the tram were entered in the SMA transportation network. By constructing the 6 km new tram route, two lanes of existing road in the route were reduced. Number of lanes changes from 4 lanes to 2 lanes. Changes in land use and traffic flow patterns in the downtown and other areas by the adoption of the tram line are expected.
The simulation start year is 2010. The simulation end year is 2030. The integrated land use model iterated runs until the end year. As shown in research framework (Fig. 2), the model provides various simulation outputs. Based on the results of the integrated land use transport model, changes in land use, traffic, CO2 emissions, and concentration of air pollutions were estimated. Analysis results were focused on Suwon.
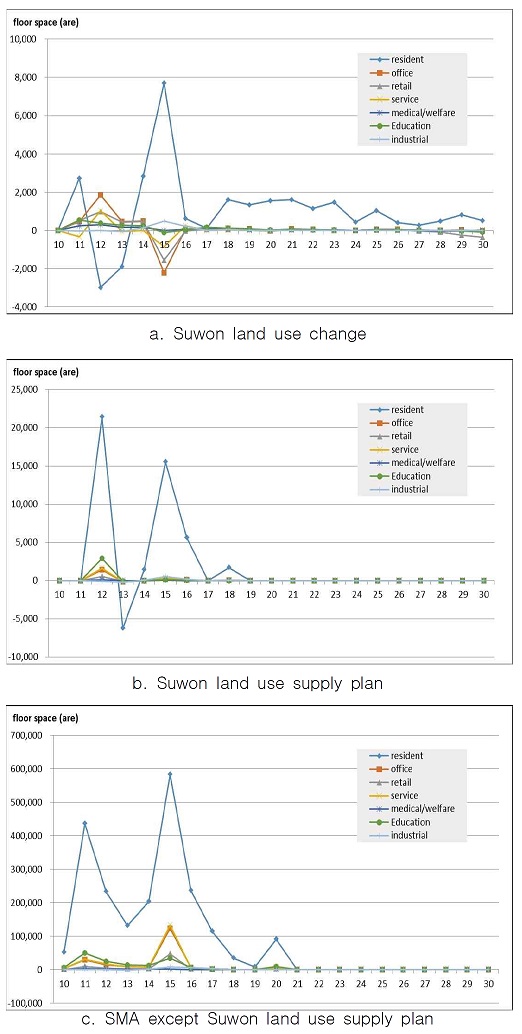
Between 2011 and 2013, land use for office, service, medical/welfare, retail, education, etc. was significantly increased by the supply of land use in Suwon. The resident land use has continued to increase since 2013.
Ⅳ. Results and discussions
4-1 Forecasting future change of Suwon in the BAU Scenario
By analyzing the changes in time, the evolution of the city were examined. For the Suwon area, two indicators, occupied floor area (㎡) by land use type in Suwon and vehicle travel distance (VKT, vehicle kilometer traveled) were selected to analyze changes in the city.
Fig. 5a shows trend in land use change in the BAU scenario from simulation results. The occupied floor area of Suwon seemed to be strongly related to urban development policies of Suwon land use supply (refer Fig. 5b and table 1). In particular, land use for the purposes of office, service, medical /welfare, retail, and education increased distinguishably between 2011 and 2013 by Suwon land use supply. The residential land use continued to increase from 2013. It may be explained by the expansion of various convenient urban infrastructures leading to the increase of attractiveness of residential areas. It was found that land use for the purposes of office, service, and retail were affected by land use supply near Suwon (Fig. 5c and Table 1). Those land use decreased between 2014 and 2016 due to increased supply of those land use near Suwon.
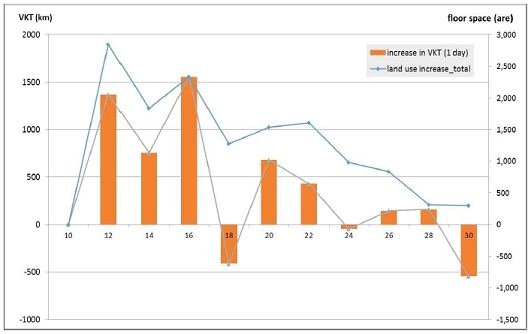
Fig. 6 shows the change in vehicle travel distance and land use increase by time period in the BAU scenario. The trends of changes in travel distance and land use are very similar. It implies that interaction between land use and transportation was considered in the simulation using the integrated land use transport model. The travel distance of Suwon substantially increased until 2016 by land use increase.
4-2 Impacts by the adoption of tram system in Suwon
This research aims to predict changes in land use and traffic patterns of the cases where a tram system is installed against the BAU case. The difference between the simulation results of the two scenarios across a long time horizon (from 2017 to 2030) was calculated and thus the effects of the alternative were predicted.
Occupied floor area by land use type, traffic volume and travel speed by road, and so on are examples of essential outcomes from the simulation to compare differences between the BAU and alternative scenarios. By analyzing changes in CO2 emissions by year, contributions of the tram to the reduction of greenhouse gas emissions compared to BAU were calculated. Also after estimating air pollutant emissions generated from road vehicles, air quality concentration of areas adjacent to the road can be estimated by using a dispersion model.
To examine changes in land use of areas adjacent to tram line, the differences between the BAU and the alternative scenarios in 2030 were represented on maps in Fig. 7. The red color means an increase while blue means a decrease in land use (Fig. 7a, c, d, e, and f) as well as CO2 emissions (Fig. 7b). The tram line is marked as thick line to show its location.
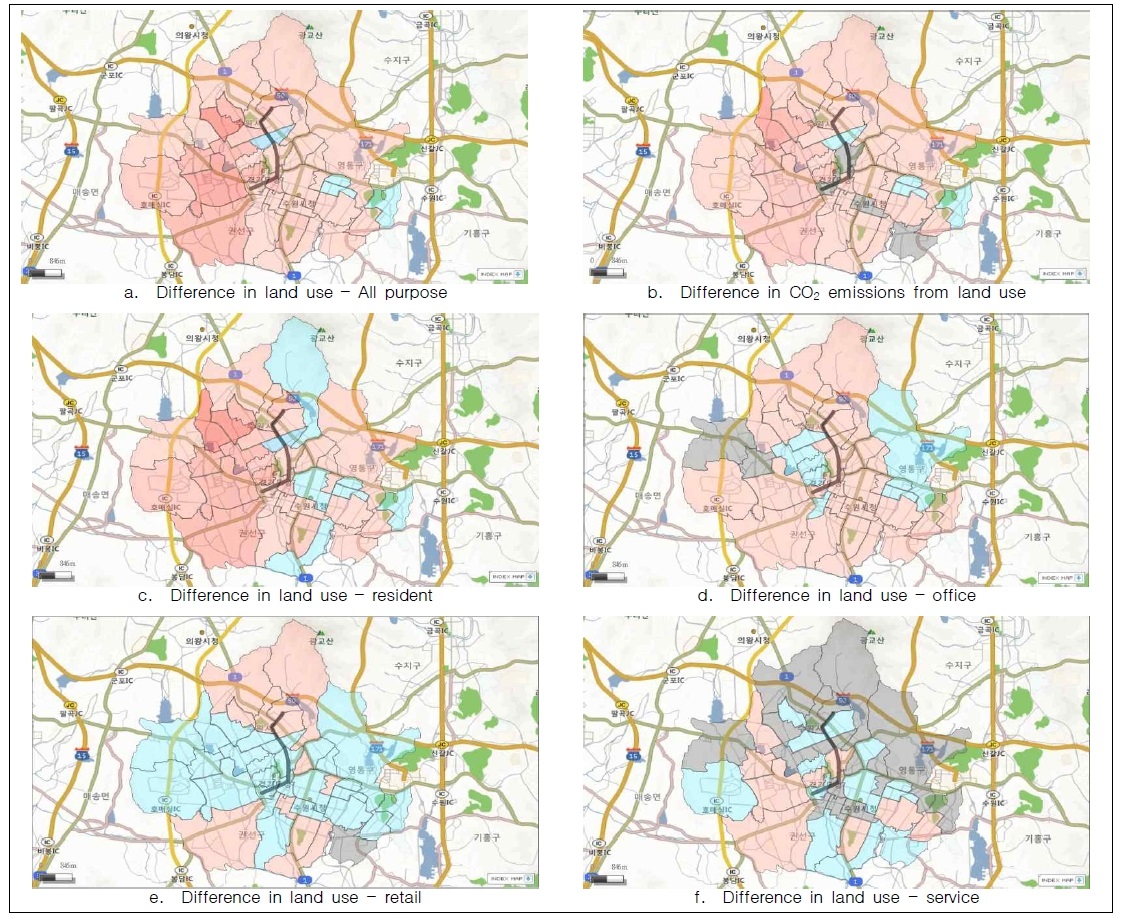
Changes in land use and CO2 Emissions by adoption of tram*note: red color denotes increase after tram introduction, blue color denotes decrease, and grey color means no change.
As shown in Fig. 7c, land use for residential purpose increased more in the outer areas than the adjacent areas to the tram route. It is deemed that demand for housing was moved from downtown to outskirts due to tram operation. Fig. 7d shows change in office land use. Due to the improved accessibility around the tram line, land use for office was moved from downtown near Suwon Station and outskirts of Suwon to the proximity of the tram line. Fig. 7e shows that land use for the purposes of retail relocated to the start and the end point of the tram route. Fig. 7f shows that land use for the purposes of service near tram route increased. As shown in Fig. 7a and b, difference in land use and CO2 emission has almost same pattern. In overall, CO2 emissions were increased by increasing land use.
The differences in traffic conditions between the BAU and the alternative scenarios in 2030 were represented on maps in Fig. 8. The red color means an increase (while stronger blue means a decrease) in traffic volumes. On the contrary, the deeper red color means a decrease (while stronger blue means an increase) in travel speeds.
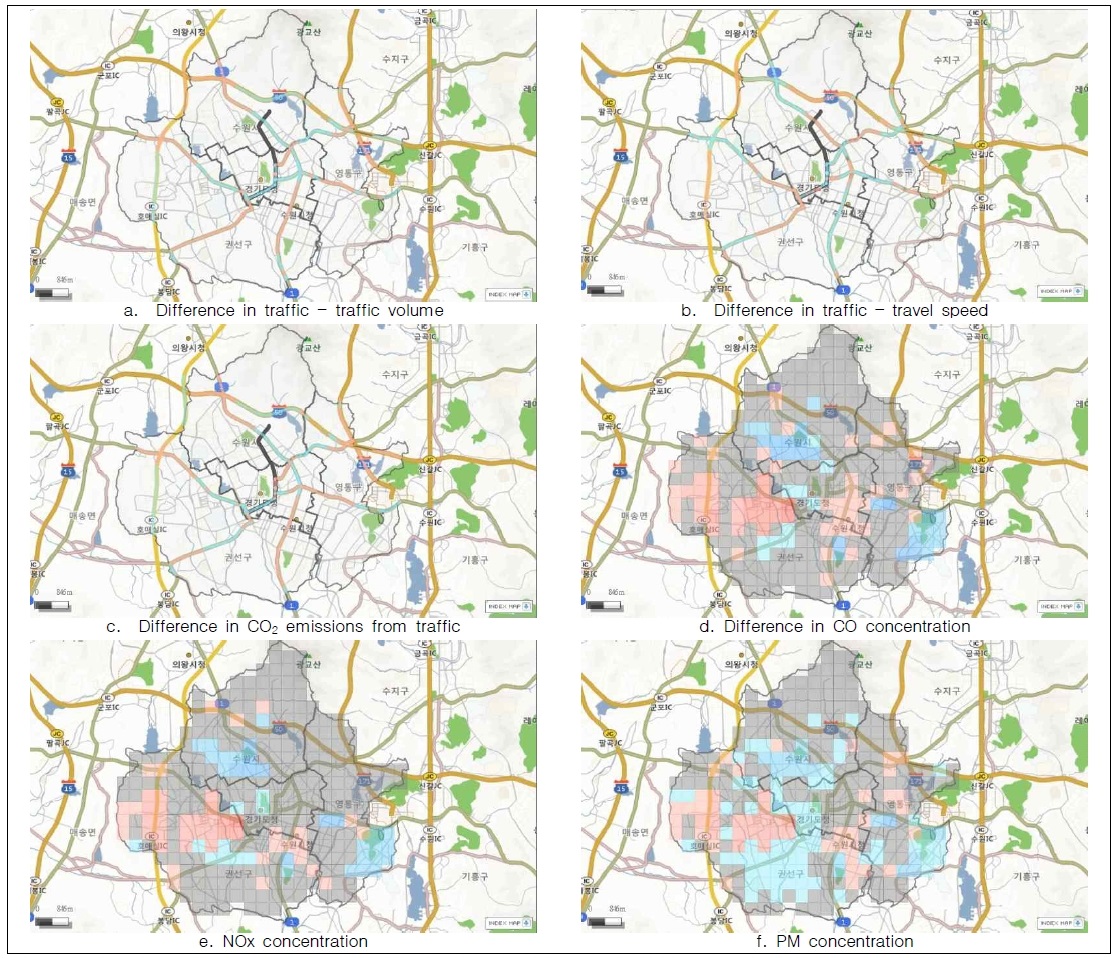
Changes in traffic, CO2 Emissions, and air pollutions by adoption of tram*note: red color denotes increase after tram introduction, blue color denotes decrease, and grey color means no change.
In Fig. 8a, traffic volume on the roads along the tram line decreased because the number of lanes decreased. Also, traffic volumes in the areas approaching to the tram line increased. As shown in Fig. 8b, travel speed of the outside of the tram line dropped due to the increase of traffic volume and traffic volumes on the roads along the tram line decreased because of the decreased road capacity. The traffic condition change causes changes in CO2 Emissions and air pollutions as shown in Fig. 8c, d, e, and f. The difference in the concentrations of the three pollutants by location shows similar pattern. Although total emissions in Suwon dropped, the concentration of the area adjacent to the tram route and approach road increased. The reason is because congestion on the roads approaching the tram line increased and accordingly the emissions increased as well.
Table 3 shows total occupied floor area and total travel distance of even-number years from the two scenarios. Differences between the two scenarios in terms of land use from were not very significant (±0.015%). The change in travel distance shows reductions. Installation of the tram line led to changes in road transportation environment including a decrease in the number of lanes as well as changes in land use, thereby resulting in the change in travel distance.
The estimated CO2 emissions of the two scenarios are shown in Table 4. There was almost no difference between the two scenarios in terms of emissions from land use in Suwon. Emissions generated from road traffic slightly decreased according to the adoption of the tram system. The total reduced amount of CO2 emissions from in 2030 is approximately 15,786 tons per year as of 0.32% decrease compared to CO2 emissions of the BAU scenarios.
Table 5 shows emissions of CO, NOx, and PM generated from road transportation in 2030 by the two scenarios. The emissions of CO, NOx, and PM decreased by 0.08, 0.11, 0.0006 ton/day, respectively. Air quality was slightly improved, but it is not significant change.
Ⅴ. Conclusion
Authors suggested using an integrated land use transport model to predict effects from the implementation of urban and transport policies in long-term perspective. They applied this methodology to predict impacts of the adoption of tram route in Suwon city as a case study to test effectiveness and validity of the method. The economic analysis results would not cover a wide variety of effects such as city population relocation, market revitalization around/origin-destination of a tram route, and so forth. However, the suggested analysis method has capability to review diverse effects from the adoption of tram since the model has capability of predicting changes in land uses as well as traffic condition by considering the interaction between land use and transportation.
In order to apply this method, required data for the integrated land use transport model (DELTA and Omnitrans) were collected. Confirmed land use development, redevelopment, regeneration, urban improvement plan and road extension plans in the study area were investigated and reflected in the analysis scenarios. The method forecasted land use and travels indicators for the BAU and tram scenarios from 2010 to 2030. Authors identified changes to the city and the effect of CO2 reduction when the 6 km long tram line is operated in Suwon from 2017.
The effects of the tram system in land use were not distinguishable due to limitation of available floor area. However, relocation of land use to the adjacent areas was shown. Housing demand was moved from downtown to outskirts. Land use for office was moved from downtown near Suwon Station and outskirts of Suwon to the proximity of the tram line. Land use for the purposes of retail relocated to the start and the end point of the tram route and land use for the purposes of service near tram route increased. These results imply the change in preference of residential area and contribution to the revitalization of adjacent business districts by tram operation. Due to a tram route, traffic volume on the roads along the tram line decreased because the number of lanes decreased. Also, traffic volumes in the areas approaching to the tram line increased.
CO2 emissions from land use were slightly raised up by increasing land use but CO2 emissions from traffics decreased by reduction of travel distance due to travel mode change to tram. As a result, it was predicted that CO2 are about 15,786 tons less emitted in 2030, which is 0.32% decrease compared to the sum of BAU scenarios. Average concentration of CO, NOx, and PM decreased. However, the concentration of pollutants in the adjacent area to the tram line and approaching road increased. It is deemed to be due to the increase of traffic congestion around a tram line and approaching roads to the tram stations.
Acknowledgments
This research was supported by a grant from the Urban Development Research Program funded by the Ministry of Land, Infrastructure, and Transport of Korea.
References
- G. D. Bottoms: Continuing Development in Light Rail Transit in Western Europe –United Kingdom, France, Spain, Portugal and Italy: Federal Transit Administration, 2003.
-
C. Mandri-Perrot, I. Menzies: Private Sector Participation in Light Rail - Light Metro Transit Initiatives: Washington, DC, The World Bank, 2010.
[https://doi.org/10.1596/978-0-8213-8085-7]

-
P. Alpkokin, S. T. Kiremitci, J. A. Black, S. Cetinavci, “LRT and street tram policies and implementation in turkish cities,” Journal of Transport Geography, Vol. 54, pp. 476-487, 2016.
[https://doi.org/10.1016/j.jtrangeo.2015.10.004]

- R. D. Knowles, F. Ferbrache: An Investigation into the Economic Impacts on Cities of Investment in Light Rail Systems: Report for UK Tram, 2014.
- L. Park, “Shifting transport policy paradigm and reporting the status of adopting tram in Suwon,” Railway Journal, Vol. 16, pp.16-19, 2013.
-
G. D. Jong, A. Daly, M. Pieters, S. Miller, R. Plasmeijer, F. Hofman, “Uncertainty in traffic forecasts: literature review and new results for the Netherlands,” Transportation, Vol. 34, pp.375-395, 2007.
[https://doi.org/10.1007/s11116-006-9110-8]

-
B. Flyvbjerg, M. K. Skamris Holm, S. L. Buhl, “Inaccuracy in traffic forecasts,” Transport Reviews, Vol. 26, 1-24, 2006.
[https://doi.org/10.1080/01441640500124779]

-
P. Mackie, J. Preston, “Twenty-one sources of error and bias in transport project appraisal,” Transport Policy, Vol. 5, pp.1-7, 1998.
[https://doi.org/10.1016/S0967-070X(98)00004-3]

- World Bank: Treatment of Induced Traffic. Transport Notes, Transport Economics: Policy and Poverty Thematic Group, 1998.
- Hankyoreh Media Company, Adopting tram in Suwon from revision of regulation[Internet]. Available: http://www.hani.co.kr/arti/society/area/701650.html/
- E. J. Miller, A. S. Paul: Integrated Land use, Transportation, Environment (ILUTE) Modelling Systems: Salvini University of Toronto, 2014.
- T. Weidner, R. Donnelly, J. Freedman, J. E. Abraham, J. D. Hunt: TLUMIP – Transport Land Use Model in Portland – Current State. Stadt Region Land 81. Aachen: Institut fur Stadtbauwesen und Stadtverkehr, 2006.
-
T. A. Arentze, H. J. P. Timmermans, “A learning-based transportation oriented simulation system,” Transportation Research. Part B: Methodological, Vol. 38, No. 7, pp. 613-633, 2004.
[https://doi.org/10.1016/j.trb.2002.10.001]

- D. Ettema, H. J. P. Timmermans. Multi-Agent Modelling of Urban Systems: A Progress Report of Puma System. Stadt Region Land 81. Aachen: Institut fur Stadtbauwesen und Stadtverkehr, RWTH Aachen, 2006.
- The IRPUD model: overview. Available: http://www.raumplanung.tu-dortmund.de/irpud/
- K. Spiekermann, The PROPOLIS Raster Module, Deliverable D4 of PROPOLIS, 2003.
-
D. C. Simmonds, “The design of the DELTA land-use modelling package,” Environment and Planning B, Vol.26, pp.665-684, 1999.
[https://doi.org/10.1068/b260665]

- OmniTRANS International. OmniTRANS product overview [Internet]. Available: http://www.omnitrans-international.com/en/products/omnitrans/product-overview/
- K. I. Kim, C. Yi, S. Lee, “A scenario analysis on transport energy consumption and carbon emission using DELTA,” Journal of Korea Planners Association, Vol. 45, pp.117-135, 2010.
-
H. Hu, C. Yang, C. Yoon, I. Kim, J. Sung, “Developing a method for estimating urban environmental impact using an integrated land use-transport model,” Journal of Korean Society of. Transportation, Vol. 33, pp.294-303, 2015.
[https://doi.org/10.7470/jkst.2015.33.3.294]

- Statistics Korea. Available: http://kostat.go.kr/portal/korea/index.action/
- Statistics Suwon. Available: http://stat.suwon.go.kr/stat/index.do
- Korea Transportation Institute. Korea transportation database [Internet]. Available: http://www.ktdb.go.kr/
2008년 : Ph.D. in Civil Engineering at Univ. of California, Irvine
2002년 : 명지대학교 교통공학 석사
2000년 : 명지대학교 교통공학 학사
2009년~현 재: 한국건설기술연구원 인프라안전연구본부 차세대인프라연구센터 연구위원 KICT School 도시 및 교통시스템 공학 세부전공책임
※ 관심분야: 도로안전, 도로관리, 지하도로

2006년 : 관동대학교 교통공학 석사
2004년 : 강릉대학교 컴퓨터공학 학사
2015~현 재: 한국건설기술연구원 인프라안전연구본부 차세대인프라연구센터 전임연구원
※ 관심분야: 도로안전, 도로관리, 도로정보, 첨단교통

