이미지 검색 서비스가 모바일 쇼핑몰 사용자 구매의도에 미치는 영향에 대한 연구
Copyright ⓒ 2019 The Digital Contents Society
This is an Open Access article distributed under the terms of the Creative Commons Attribution Non-CommercialLicense(http://creativecommons.org/licenses/by-nc/3.0/) which permits unrestricted non-commercial use, distribution, and reproduction in any medium, provided the original work is properly cited.

초록
최근 모바일 쇼핑몰에서 상품구매력을 높이기 위해 이미지 검색 서비스 도입을 시도하고 있다. 본 논문에서는 모바일 쇼핑몰에서 이미지 검색 서비스의 요소들이 사용자의 구매의도와 어떤 관계가 있는가를 연구하고자, 편재성, 이용성, 유희성, 정보품질을 독립변수로 선정하고, TAM모형을 바탕으로 실증 연구를 진행 하였다. 연구결과 편재성과 이용성은 구매의도와 관계가 미비하고, 유희성과 정보품질이 사용자의 구매의도와 관련이 있는 것으로 나타났다.
Abstract
Recently, it is trying to introduce an image search service in order to increase its purchasing power in mobile shopping malls. In this paper, the elements of image search services in mobile shopping malls were selected as independent variables and verified based on the TAM model to study how the elements of image search services relate to the user's intention to purchase them. Research has shown that bias and usability have little to do with purchase intentions, and that entertainment and information quality are related to user's intention to purchase.
Keywords:
Image Search Service, Mobile Shopping Mall, Usability, Purchase Intention, TAM키워드:
이미지 검색 서비스, 모바일 쇼핑몰, 이용성, 구매의도, TAMⅠ. 서 론
인터넷이 확산됨에 따라 인터넷을 통한 온라인 쇼핑몰과 쇼핑 문화는 발전했으며 최근 급속한 스마트폰의 보급과 함께 자연스럽게 모바일 쇼핑몰 환경이 확산되기 시작했다. 모바일 쇼핑몰은 장소와 시간에 구애받지 않고 언제 어디서나 쇼핑이 가능하다는 장점이 있어 다양한 서비스를 제공하고 있다. 특히 스마트폰의 위치 확인 기능과 카메라 기능과 융합하여 온라인, 오프라인이 융합된 서비스가 빠르게 확산 중이며 한 예로 사용자는 길거리 매장에서 맘에 드는 상품을 발견했을 경우 해당 상품을 검색하여 더 싸게 판매하는 온라인 쇼핑몰을 검색할 수도 있고 거리 광고지에 찍혀 있는 상품에 대한 바코드 정보를 촬영하여 해당 모바일 매장으로 직접 연결하여 구매할 수 있는 서비스를 이용할 수도 있다.
이미지 검색(Image Search or Image To Image Search, 이하 Image Search) 서비스는 이미지를 직접 질의 조건으로 입력하여 유사 이미지를 검색하는 서비스를 뜻한다. 기존 텍스트 기반 이미지 검색 서비스의 경우 사용자가 이미지를 설명하는 문장을 입력하거나 이미지에 해당하는 대상의 이름을 키워드로 질의어를 입력하면 (이미지, 키워드) 쌍의 형태로 저장된 데이터베이스에서 키워드들을 이용하여 간접적으로 유사 이미지를 검색하는 서비스이다. 따라서 사용자가 이미지 검색을 위해서 키워드를 입력해야 할 경우에도 결과의 유사성에 대해 만족할 만한 성능을 내기가 어렵다. 이미지 검색 서비스는 이미지를 질의 조건으로 직접 입력하기 때문에 이런 기존 검색 서비스의 단점 해결이 가능하여 검색 만족도를 한층 높일 수 있다. 또한 스마트폰의 카메라와 결합할 경우 카메라 촬영 대상에 대해 직접 검색이 가능하다. 이런 장점으로 인해서 최근 모바일 쇼핑몰에서 이미지 검색 서비스 도입을 시도하고 있으며 이것은 모바일 쇼핑몰의 서비스 품질을 획기적으로 향상 시킬 것이라고 예상되며 모바일 쇼핑몰에서 상품 구매력을 높이게 될 것으로 생각된다. 본 논문에서는 모바일 쇼핑몰에서 모바일 쇼핑몰에서 쇼핑 시에 이미지 검색 서비스 이용이 사용자의 구매의도와 어떤 관계성이 있는가를 가설을 세우고 설문을 통해서 실증 분석을 실시하였다.
Ⅱ. 이론적배경
2-1 모바일 쇼핑(Mobile Shopping)
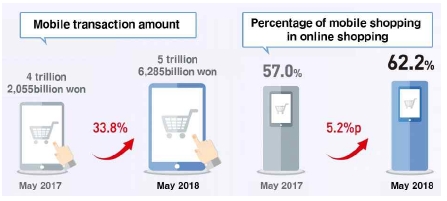
모바일 쇼핑과 관련된 초기 연구로는 Durlacher Research Ltd.(1999)가 발표한 Mobile Commerce Report가 있으며 모바일 커머스(mobile commerce)를 “무선통신기기의 네트워크를 이용해 거래되는 모든 유형의 금전적 가치”로 정의하였다[1]. 최근 연구로는 휴대폰을 이용하여 정보검색 및 구매를 하는 모든 형태의 거래를 모바일 쇼핑 이라 하였다[2]. 따라서 모바일 쇼핑은 모바일 환경에서 이루어지는 다양한 형태의 거래라 할 수 있다. 현재 온라인쇼핑 거래 총액은 전년 동월대비 22.7% 증가하였고, 모바일쇼핑 거래액은 전년 동월대비 33.8% 증가 하였다. 특히 모바일 쇼핑이 온라인쇼핑에서 차지하는 비중은 62.2%로 모바일을 통해서 많은 사용자들이 검색하고 쇼핑하는 것을 알 수 있다[3].
2-2 이미지 검색(Image Search)
이미지 검색은 이미지에서 자동으로 추출한 속성을 이용하기 때문에 다양한 속성에 대하여 효율적인 표현이 가능하며 의미가 불분명한 이미지의 검색도 가능하다.
최근 쇼핑몰 업체는 온라인 쇼핑몰에 인공지능 기반 이미지검색 기술을 도입하여 제공하기 시작했다. 이는 패션 상품에서 디자인 중심의 유사 상품 검색이 가능하며 사용자가 옷 또는 신발을 선택할 경우 스타일에 맞는 양말과 액세서리와 같은 연관 상품 추천까지 가능하다[4]. 이러한 기술들은 이미 선두 업체들을 중심으로 빠르게 도입되고 있으며, 구글(Google)의 '구글포토' 서비스는 사용자가 촬영한 사진 분류 기능에 AI를 적용하였고, AR(증강현실)서비스를 접목하여 카메라를 물체에 갖다 대면 식별이 가능하다. 국내의 경우 네이버와 카카오가 이미지 검색시장에서 서비스를 출시하고 있고, 종합몰이나 오픈마켓에서도 적용하고 있다.
2-3 기술 수용 모형
기술수용모형(TAM , Technology Acceptance Model)은 혁신기술의 하나인 컴퓨터 수용에 대한 사용자들의 행동을 설명하기 위해 Davis가 1986년 처음 개발하였고 1989년 공식화한 모형이다[5]. 기술수용모형에서 인지된 유용성과 인지된 용이성이 정보기술 사용의도에 미치는 영향연구는 대부분의 선행연구에서 정(+)의 관계가 검정되었다[5][6].
기술수용모형은 국내외적으로 첨단기술을 수용하는 사용자의 행동을 이해하는데 설명력이 매우 높은 모형으로 , 웹 서비스, 전자메일, 인터넷 쇼핑, 이러닝(e-learning), 모바일 커머스 등의 다양한 분야에서 수용자의 행동을 연구하여 왔다[7]. 이러한 이유로 본 논문에서는 이미지 검색 서비스의 어떤 요인들이 모바일 쇼핑몰에서 사용자의 구매의도까지 양향을 미치는지에 대해서 알아보기 위해서 기술수용모형의 독립변수를 확장하여 연구하는 것이 적합하다고 판단하였다.
Ⅲ. 제 3 장 연구문제 및 가설
3-1 연구문제
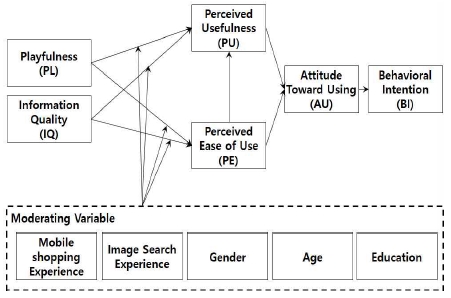
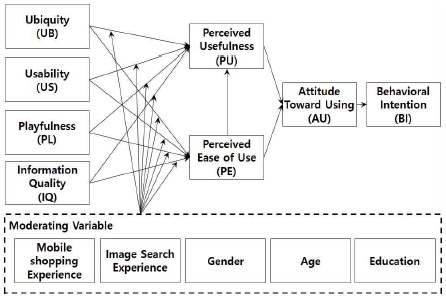
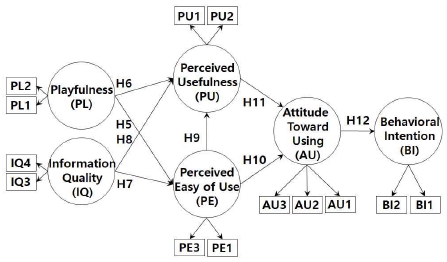
이미 기술한 바와 같이 본 연구의 목적은 모바일 쇼핑몰에서 쇼핑 시에 이미지 검색 서비스 이용이 사용자의 구매의도에 미치는 영향을 분석하는 것이다. 이를 위해 본 연구에서 제안하는 연구 모형은 Fig. 3의 제안 연구모형(Proposal Research Model)과 같다. 처음에는 기술수용모형과 선행 연구를 바탕으로 Fig. 4와 같은 초기 연구 모형(Initial Research Model)을 설계했다. 초기 연구모형은 편재성(Ubiquity), 이용성(Usability), 유희성(Playfulness), 정보품질(Information Quality), 지각된 편의성(Perceived Easy of Use), 지각된 유용성(Perceived Usefulness), 이용의도(Attitude Toward Using), 구매의도(Behavioral Intention)를 변수로 가지도록 설계되었다. 그러나 초기 모형은 연구 과정에서 반복적인 분석을 통해 수정하고 변경되었으며 최종적으로 Fig. 3의 제안 연구모형이 적합하다는 결론을 얻었다.
3-2 가설 설정
Mark Weiser(1991)에 의하면 모바일 사용자는 항상 네트워크로 연결된 상태로 인터넷에 접속하여 다양한 정보에 접근하여 활용할 수 있는 대상이라고 하였다. 또한 많은 정보가 사용자에게 즉시 전달가능하고 자신의 위치와는 상관없이 실시간으로 원하는 정보를 접할 수 있는 특성을 지니고 있다고 하였다[8]. Looney et al.(2004)은 편재성은 놀랄만한 유연성과 편리성을 제공해주고 언제 어디서든 가상으로 잘 교류 할 수 있는 능력으로 개인의 모바일 정보기술 사용의도에 영향을 미치는 요인이라고 주장하였다[9]. 모바일 환경에서 편재성(Ubiquity)은 편재 접속성이라고 불리기도 하며, 많은 선행연구에서 유비궈터스(ubiquitous)나 모바일 기기의 특성을 가장 잘 나타내는 속성으로 검증되었으며, 사용자의 위치에 따라 모바일 기기를 통해 원하는 컨텐츠를 신속히 이용할 수 있다는 즉시 접속성과 유사한 개념이다[10]. 편재성은 온라인 서비스와 모바일 서비스를 구별하는 가장 중요한 요소 중 하나로 서비스의 유용성과 만족도 등의 수용과정에 영향을 미칠 수 있다[11][12]. 편재성은 이동하면서 언제 어디서나 원하는 정보를 검색할 수 있는 속성으로, 본 연구의 모바일 중심 이미지 검색 서비스의 장점을 설명하기에 가장 적합하다.
“가설 1(H1). 편재성은 지각된 편의성에 유의한 영향을 미칠 것이다.”
“가설 2(H2). 편재성은 지각된 유용성에 유의한 영향을 미칠 것이다.”
GUI(Graphic User Interface) 기반의 소프트웨어, 애플리케이션, 웹 사이트, 상호작용이 가능한 기기에서 이용성(Usability)은 점차 중요한 요소로 인식되어지고 있다. 이용성은 특정 시스템을 이용하는 다수의 사용자가 그들의 작업을 수행 할 때 속도와 정확성, 그리고 생산성을 높이는데 있어 중요한 역할을 한다[13]. Jeng (2005)[14]은 이용성을 사용의 편의성 차원에서 접근해야 한다고 주장하였고, 편의성 이외에도 이용성(Usability)이 유용성(Usefulness)과 밀접한 관계가 있음을 주장하였다. 또한, Blandford과 Buchanan (2002)은 이용성을 기술과 사회, 디자인 등 여러 관점에 서 바라보는 것이 바람직하다고 주장하였다[15]. Turner (2002)[16]는 경로이동 시스템을 통한 접근성, 멀티미디어를 포함한 컨텐츠, 웹페이지 구조, 상호작용성, 디자인 일관성을 이용하여 웹사이트의 이용성 측정을 시도하였다. 효과적으로 설계된 이용성은 사용자가 원하는 목표를 빠르게 달성할 수 있도록 내비게이션 흐름을 잘 잡아줘야 하고, 폰트의 선택, 공간의 배열 등을 고려하여 가독성이 좋도록 설계되어야 한다[17]. 이용성이 좋은 쇼핑몰은 이미지 검색을 이용하는 것이 쉽고, 원하는 상품을 효율적으로 충분히 찾을 수 있을 것으로 본다. 따라서 이용성은 구매의도에 까지 좋은 영향을 미칠 것으로 판단된다.
“가설 3(H3). 이용성은 지각된 편의성에 유의한 영향을 미칠 것이다.”
“가설 4(H4). 이용성은 지각된 유용성에 유의한 영향을 미칠 것이다.”
Negash, RyanandIgbaria(2003)[18]는 웹 기반 시스템의 유희성이 중요하며 재미, 즐거움, 흥분감 등을 나타낸다고 하였다. 심점숙(2007)[19]은 사이트 이용자의 재미 추구성이 사이트에 대한 몰입에 유의한 영향을 미치는 요소 중 하나라고 하였다. 이미지 검색을 통하여 모바일 쇼핑을 하는 경우, 유희성은 사용자에게 재미적인 요소를 주고, 검색결과에 더욱 흥미가 생길 것으로 보인다. 또한 검색결과에 대한 호기심으로 연관검색을 해서 결과적으로 구매의도에 영향을 미치리라 판단된다.
“가설 5(H5). 유희성은 지각된 편의성에 유의한 영향을 미칠 것이다.”
“가설 6(H6). 유희성은 지각된 유용성에 유의한 영향을 미칠 것이다.”
정보 품질(Information Quality)은 콘텐츠와 정보에 대한 품질로, Seddon은 적절성(Relevance), 정확성(Accuracy), 적시성(Timeliness)등 세 가지 항목으로 평가할 수 있다[20]. 사용자는 정보를 전체를 볼 때 정확한 의미를 알 수 있으나 모바일 디자인에서는 화면의 크기 가 작기 때문에 전체를 보여주기 어려운 경우가 많다[21]. 따라서 제한된 공간의 모바일 환경에서는 올바른 정보의 양보다는 제공된 정보의 정확률이 더 큰 의미를 가진다[22]. 적시성은 필요할 때에 원하는 것을 얻을 수 있는 정도[23], 최신성은 정보의 내용과 업데이트가 빠르게 이루어지는 정도라 하였다[24]. 정보품질은 정확성, 적시성, 최신성의 특징을 가지고 있다. 특히, 모바일 쇼핑 시에는 최신 제품에 대해 소비자들이 호기심을 가지고 있을 때 정확하고 빠른 정보를 적시에 제공하여 구매의도를 자극하고 구매의사가 결정되도록 해야 한다.
“가설 7(H7). 정보품질은 지각된 편의성에 유의한 영향을 미칠 것이다.”
“가설 8(H8). 정보품질은 지각된 유용성에 유의한 영향을 미칠 것이다.”
기술수용모형을 적용한 모바일 쇼핑 분야의 선행연구들에서도 연구자에 따라 각 변수들을 조작적으로 정의하였다. 지각된 유용성은 사용자가 모바일 커머스를 이용하여 필요한 목적을 달성하는데 드는 시간이나 노력이 절감될 것이라 믿는 정도[25]. 지각된 용이성은 모바일 쇼핑을 편하게 이용할 수 있는 정도라 하였다[26]. 본 논문에서는 지각된 용이성을 지각된 편의성과 같은 개념으로 보고, 효과적이고 편리하다고 믿는 정도로 정의한다. 기술수용모형은 지각된 유용성, 지각된 사용용이성이 사용에 대한 태도에 영향을 미치고, 태도는 사용의도에, 태도는 사용의도를 거쳐 실제 시스템 행동에 영향을 미치는 것으로 가정한다. 본 연구에서도 기술수용모형을 기반으로 독립변수를 확장하여 다음과 같은 가설을 세우고 분석을 진행하였다.
“가설 9(H9). 지각된 편의성은 지각된 유용성에 유의한 영향을 미칠 것이다.”
“가설 10(H10). 지각된 편의성은 이용의도에 유의한 영향을 미칠 것이다.”
“가설 11(H11). 지각된 유용성은 이용의도에 유의한 영향을 미칠 것이다.”
“가설 12(H12). 이용의도는 구매의도에 유의한 영향을 미칠 것이다.”
Table 1은 각각의 변수들에 대해 본 논문에서 제시한 가설에 대해 하나의 표로 정리한 것이다. 표 내용에서 경로(Path)는 가설별로 변수들 간에 유의한 영향을 주는 방향과 관계성을 간소화하여 설명한 것이다.
Ⅳ. 분석 결과
본 논문에서 설문 조사는 Table 3과 같은 내용으로 인터넷을 이용한 온라인 설문과 설문지를 이용한 오프라인 설문을 병행했다. 각 문항은 리커트 7점 등간 척도로 구성했고 다양한 연령층의 모바일 사용자 170명을 대상으로 2018년 10월 9일부터 12월18일까지 수집하였다. 구조방정식으로 통계적 검정을 하였으며 표본의 일반적 특성은 SPSS 18.0을 이용하여 분석하였고 연구모형은 AMOS 18.0을 사용하여 분석하였다.
4-1 표본의 일반적 특성
Table 4은 일반적 특성에 대한 빈도분석이다. 남자는 118명으로 70.7%, 여자는 49명으로 29.3%이며 20대 미만은 2명(1.2%), 20대는 90명(53.9%), 30대는 17명(10.2%), 40대는 41명(24.6%), 50대는 15명(9.0%), 6.00 2명(1.2%)이다. 직업은 학생 50.9%(85명), 기술직 7.2%(12명), 판매업 6.6%(11명), 전문직 25.7%(43명), 기타 9.6%(16명)으로 나타났다. 학력은 고졸 12.6%으로 21명, 대학재학 40.1%으로 67명, 대학졸 12.6%으로 21명, 대학원 이상 34.7%으로 58명으로 나타났다.
Table 5 이용 실태 측면에서 모바일쇼핑이용은 없음 18명으로 10.8%, 3회 미만 28명으로 16.8%, 월1~4회 69명으로 41.3%, 월4회 이상 35명으로 21.0%, 거의매일은 17명으로 10.2%으로 나타났다. 쇼핑시 이미지 검색이용은 없음은 81명(48.5%), 3회 미만 36명(21.6%), 월1~4회 27명(16.2%), 월4회 이상은 16명(9.6%), 거의매일 7명(4.2%)으로 나타났다. 이미지검색사용은 없음 26.3%(44명), 3회 미만 29.3%(49명), 월1~4회 22.8%(38명), 월4회 이상 13.2%(22명), 거의매일 8.4%(14명)이다.
4-2 측정모형 분석
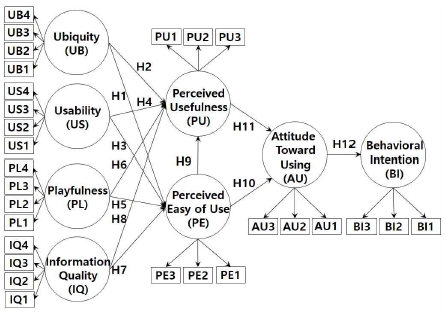
Fig. 5는 본 논문에서 제시한 초기 연구모형을 구조방정식 모형으로 변경한 것으로 AMOS를 이용해서 분석을 수행했다. 측정모형 분석은 모든 잠재변수와 측정변수 간에 단일차원성을 평가하는 작업으로 모형의 적합도를 확인하는 것이다. 해당 모형에 대한 적합도를 측정하기 위해 측정모형 분석을 수행했으며 별도 수정을 가하지 않은 초기 연구모형의 분석된 모형의 적합도는 Table 6와 같다.
Table 6에서 나타난 것처럼 해당 모형은 적합도 수준이 CFI, IFI, RMSEA 3개 항목에서만 만족하므로 수용가능한 수준이라고 할 수 없다.
4-3 수정된 연구모형
Table 6 결과를 바탕으로 본 논문에서는 초기 모형이 적합하지 않은 것으로 결론을 내렸고 적합한 모형 확보를 위해 추가적인 수정이 필요했다. 따라서 본 논문에서는 SMC(Squared Multiple Correlations, 다승상관지승) 값 등을 토대로 모형 적합도 확보를 위한 재분석을 수행했고 최종적으로 Fig. 6과 같이 수정된 연구모형을 제안한다.
측정모형에 있어서 SMC 수치는 측정변수가 잠재변수를 얼마나 잘 설명하고 있는가에 대한 판단기준을 제공하는 지표이다. 측정모형에 있어서 SMC 수치는 측정변수의 신뢰도 평가에 이용할 수 있으며 일반적으로 측정변수의 SMC 수치가 높으면 잠재변수를 잘 설명하고 있다는 것이고 반대는 설명하지 못한다는 의미이다. 따라서 재분석 과정은 측정변수의 SMC 값이 가장 작은 변수들을 기준으로 하나씩 제거하거나 연관된 변수들을 반복적으로 제거하면서 실시했다. 측정변수를 제거할 때마다 SMC 수치는 변동이 발생하며 Table 6에서 초기 모형과 수정 제안된 모형에 대한 SMC 수치 변화를 확인할 수 있다. Table 7은 본 논문에서 제안한 초기 연구모형과 최종 수정된 연구모형의 각 변수들에 대한 SMC 수치 변화를 비교한 것이다.
반복적 재분석을 통해 최종적으로 Fig. 6과 같이 편재성(Ubiquity)와 이용성(Usability)은 모형의 적합도 향상에 부정적인 영향을 주는 것으로 나타나 제거했다. 또한, 유희성(Playfulness)와 정보품질(Information Quality)에서 측정변수 PL3, PL4, IQ1, IQ2를 제거했고 지각된 편의성(Perceived Easy of Use)과 지각된 유용성(Perceived Usefulness)에서도 두 개의 측정변수 PE2와 PU2를 제거했다. 특히, 구매의도(Behavioral Intention)의 BI2항목은 가장 낮은 SMC 값을 보였고 제거했을 때 모형 적합도 향상에 많은 영향을 주는 것으로 확인했다.
Table 8은 최종 제시한 수정 모형에 대한 측정모형 분석 결과이다. 각 개념(Construct)과 측정변수(Measured Variable)들 간의 SMC 수치는 모두 0.4 이상으로 잠재변수(Latent Variable)는 측정변수들의 변량을 잘 설명하는 것으로 분석되었다. 또한, 잠재변수와 측정 변수 관계에 대한 모수추정치가 모두 0보다 큰 값을 보이고 있으며 추정치에 대한 C.R.(Critical Ratio) 수치도 모두 2를 상회하고 있다. 그리고 내적일관성과 관련된 신뢰도에 있어서 Cronbach α 값은 0.65~0.89 사이로 수용 가능한 신뢰도 수준인 0.6 보다 큰 것으로 나타났다.
Table 9은 측정모형에 대한 적합도를 평가한 것이다. 초기 연구모형이 CFI, IFI, RMSEA 3개 항목만 통과한 것에 비해 모든 항목들이 통과했다. 수정 제시한 최종 모형의 측정모형에 대한 카이스퀘어(Chi-square) 결과는 아래와 같다.
CMIN = 62.773, DF=50, P=0.106, CMIN/DF=1.255
즉, 카이스퀘어 값은 62.7, 자유도는 50이며 특히 유의확률(P)이 0.106로 적합한 것으로 나타났다. CMIN/DF 수치도 2이하로 적정하며 초기 모형에서 기각(Reject) 판정이 되었던 RMR, GFI, AGFI 수치도 모두 기준치를 상회하고 있으며CFI(Comparative Fit Index) 수치는 초기 모형 0.913에 비해 0.993로 크게 상회한 것으로 나타났다. 마찬가지로 NFI, IFI 수치도 개선되어 기준에 부합했다. RMSEA(Root Mean Square Error of Approximation)은 절대적 적합도 지수(Absolute Indices of Fit) 중에 하나로 모집단에서 모형을 추정할 때 기대되는 적합도를 의미하며 0~1 사이의 값을 가진다. RMSEA는 0에 가까울수록 좋은데 일반적으로 0.05 이하일 경우 높은 적합도(Good Fit)을 의미하고 0.05~0.1 사이일 때 수용 가능한 수준(Adopt Fit)을 의미하며 RMSEA 값이 0.1 이상이면 적합도가 낮은(Poor Fit) 것으로 간주한다. 수정 제시한 최종 제안 모형은 RMSEA 값이 0.039로 높은 적합도를 가지는 것으로 나타났다.
4-4 측정모형 타당성 평가
본 논문에서 최종 제안한 모형은 수용 가능한 적합도를 가지고 있는 것으로 나타났다. 따라서 측정모형의 타당성 평가가 필요하며 집중 타당성(Convergent Validity) 검증 기법과 판별 타당성(Discriminant Validity) 검증 기법을 통해 평가하였다. 먼저 집중 타당성 평가는 아래 두 가지 기법을 사용하였다.
VE(Variance Extracted, 분산 추출)의 평균값CR(Construct Reliability, 개념 신뢰도)
VE의 평균값은 각 변수별 표준화 추정치(Standardized Factor Loading)를 항목수로 나누어 계산하는 것으로 값이 0.5 이상이면 집중타당성이 있다고 해석한다. 공식은 아래와 같다.
CR은 값이 0.7 이상이면 집중타당성이 있다고 해석한다. 공식은 아래와 같다.
Table 10은 최종 제안 모형에 대한 집중타당성 평가 결과이다. 결과에서 볼 수 있듯이 VE 값은 모두 0.5를 상회하고 있고 CR 값도 0.7을 초과했다. 따라서 최종 제안 모형은 집중 타당성이 있다고 해석할 수 있다.
판별 타당성은 서로 다른 변수들 간에 그 측정치에도 뚜렷한 차이가 있다는 것을 의미한다. 차이 계산을 위해 상관계수 값을 기준으로 하며 한 변수와 다른 변수 간에 상관관계가 낮아야 판별 타당성이 있다고 할 수 있다. 판별 타당성 평가를 위해서는 AVE(Average Variance Extracted, 평균분산추출) 기법과 표준오차 추정구간(Two Standard Error Interval Estimate) 기법을 통해 평가할 수 있다.
AVE를 이용한 기법은 아래와 같이 산출가능하며 변수들 간의 상관계수 제곱 값이 AVE 값 이하일 경우 판별 타당성이 있다고 할 수 있다.
표준오차 추정구간은 변수들 간에 상관관계가 낮아야 판별 타당성이 확보된다는 것을 검증하기 위한 것으로 아래 공식을 이용하며 결과가 1이 아니면 판별 타당성이 있다고 판정한다.
본 논문에서는 두 가지 방법을 모두 사용하여 판별 타당성을 평가했다. Table 11은 판별 타당성을 검증하기 위해 필요한 수치들을 기재 한 것으로 상관 계수(Corelation Coefficient)와 표준 오차(Standard Error) 그리고 AVE 값이다. 위에서 제시한 공식에 해당 수치들을 이용해서 계산을 한 결과 변수들 간의 상관계수 제곱 값은 AVE 값을 초과하지 못했고 표준오차 추정구간에서 어떠한 상관계수도 1을 포함하지 않는 것을 확인했다. 따라서 수정 제시한 측정 모형은 판별 타당성을 확보했다고 할 수 있다.
Ⅴ. 가설 검증
5-1 최종 제안 가설
모델 적합도 분석을 통해 초기 모델을 변경하여 수정 제안한 최종 모형에 따르면 편재성과 이용성이 제거되었다. 사실 상 이것은 독립변수 편재성과 이용성이 모바일 쇼핑몰에서 이미지 검색 서비스를 이용할 경우 사용자의 구매의도에 영향을 줄 수 없다는 것을 의미한다. 따라서 초기 제시된 가설에서 편재성과 이용성에 관련된 가설들도 모두 제거했다. H1~H4가 이에 해당하며 H1~H4를 제거하여 수정 제안한 가설은 Table 12와 같다. Table12의 내용은 본 논문에서 최종 제안한 가설이며 이번 장에서는 해당 가설이 맞는지 검증했다.
5-2 가설 검정 결과
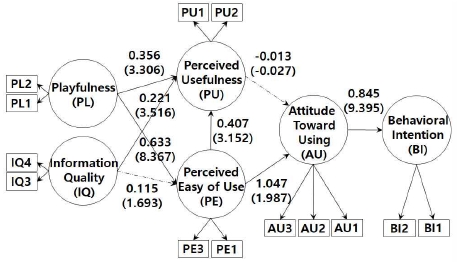
최종 제안 모형을 분석하면 Table 13과 같이 나타난다. 가설 H7은 P 값이 0.05를 초과했고 H11은 CR 값이 음수로 나왔으며 P값 또한 0.05를 초과했으므로 채택하지 않았다.
5-3 적합도 검증 결과
가설 검증 결과을 수용하기 위해서는 최종 제안 모형(Final Proposed Model)에 대한 적합도 검증 결과가 기준을 통과해야 한다. Table 14는 본 논문에서 최종 제안하는 모형에 대한 적합도를 계산한 결과이다. 제안 모형의 적합도 향상 결과에 대한 효율적인 비교를 위해 처음 제시했던 모형의 적합도 결과도 기재했다. 해당 결과에서처럼 제안 모형은 적합도 판정을 위해 제시된 기준들을 모두 통과했으며 특히 RMSEA 수치는 0.02로 높은 적합도를 가지고 있음을 알 수 있다. 초기 모형이 CMIN P, CMIN/DF, RMR, GFI, AGFI, NFI 6개 항목에서 모두 기준치를 통과하지 못했고 CFI, IFI, RMSEA 3개 항목만 통과한 반면 제안 모형은 모든 기준치에서 향상을 나타내었다.
Ⅵ. 결론
가설 검증 결과와 제안 모형의 적합도 검증 결과에 의해서 제안 모형은 모집단을 충분히 설명할 수 있다고 볼 수 있다. Fig. 7은 해당 결과들을 바탕으로 작성한 제안 모형의 변수 간 경로에 대한 추정 결과이다.
그림에서 알 수 있듯 유희성과 지각된 편의성과 지각된 유용성에 정(+)의 영향을 가지며 정보품질은 지각된 유용성에 정(+)의 영향을 주고 지각된 편의성은 이용의도에 정(+)의 영향을 , 이용의도는 구매의도에 정(+)의 영향을 주는 것으로 나타났다. 정보품질과 지각된 편의성과의 관계를 나타내는 H7과 지각된 유용성과 이용의도와의 관계를 나타내는 H11은 기각되었다.
결론적으로 모바일 쇼핑 시에 이미지 검색 서비스 이용에 있어서 유희성과 정보품질은 사용자의 구매의도에 유의한 영향을 주는 것으로 나타났다. 다만, 초기 연구모형에서 설정한 편재성과 이용성은 분석과정에서 적합하지 않은 것으로 파악 되었는데 이것은 모바일 디바이스가 보편화된 현재에는 과거에 중요하게 인식되었던 편재성과 이용성이 사용자에게 더 이상 크게 인식되지 않고 당연하게 받아들여진다고 판단된다. 해당 현상과 유사한 사례에 대하여 이지원(2016)[38]은 본인의 논문에서 편리성과 용이성에 대해 같은 견해를 제시했다.
해당 논문은 모바일 쇼핑 시 이미지 검색 서비스를 이용하는 것에 있어서 어떤 요인들이 사용자의 구매의도에 영향을 주는 가를 분석했다. 다만, 편재성과 이용성에 대해서는 가설이 기각되었는데 기술수용모형을 UTAUT 모형 등으로 변경하여 추가 연구가 필요할 것으로 생각된다.
참고문헌
- Muller-Veerse, F., Mobile Commerce Report, Durlacher Research Ltd., (1999).
- Xiao Meng, (2014), The Effect of Mobile Commerce Attribute on Continuous Intention of Usage : Applying Technology Acceptance Model(TAM), Konkuk University, Master dissertation.
- Short-Term Service Statistics Division in Economic Statistics Bureau. Online shopping trend survey, Seoul, Statistic Korea, 2018-07.
-
Veit, A., Kovacs, B., Bell, S., McAuley, J., Bala, K., & Belongie, S., (2015), Learning visual clothing style with heterogeneous dyadic co-occurrences, In Proceedings of the IEEE International Conference on Computer Vision, p4642-4650.
[https://doi.org/10.1109/ICCV.2015.527]

-
Davis, F. D., (1989), Perceived usefulness, perceived ease of use, and user acceptance of information technology, MIS quarterly, p319-340.
[https://doi.org/10.2307/249008]

-
Venkatesh, V., & Davis, F. D., (2000), A theoretical extension of the technology acceptance model: Four longitudinal field studies, Management science, 46(2), p186-204.
[https://doi.org/10.1287/mnsc.46.2.186.11926]

- You, Jae-Hyun, & Park, Cheol, (2010), A Comprehensive Review of Technology Acceptance Model Researches, Entrue Journal of Information Technology, 9(2), p31-50.
-
Kannan, P. K., Chang, A. M., & Whinston, A. B., (2001, January), Wireless commerce: marketing issues and possibilities, In System Sciences, (2001, Proceedings of the 34th Annual Hawaii International Conference on, p3526-3531, IEEE.
[https://doi.org/10.1109/HICSS.2001.927209]

- Xie, Pei lan, (2016), A Study on the Influential Factors on the Continuous Use Intention of Mobile Payment Service, Konkuk University, Master dissertation.
- Kim, Ho-Young, (2002), Empirical Research On Important Factors of Mobile Internet Usage = Empirical research on important factors of mobile internet usage, Yonsei University, Master dissertation.
- T. C. Kang, “How Users’ Perceived Ubiquity of Mobile Service Influences on the Satisfaction and the Continuance Usage Intention”, Korean Journal of Journalism, 18(4), p5-34, (2014).
- Kyeong-Rak Lee, Mee-Sung Kim, Sang-Joon Lee, A Study on the Influence of Telephone Apprehension Affecting Continuous Use Intention of Mobile O2O Commerce, Journal of Digital Contents Society, 19(4), p661-671, (2018).
-
Seffah, A., Donyaee, M., Kline, R. B., & Padda, H. K., (2006), Usability measurement and metrics: A consolidated model, Software Quality Journal, 14(2), p159-178.
[https://doi.org/10.1007/s11219-006-7600-8]

-
Jeng, J., (2005), What is usability in the context of the digital library and how can it be measured?, Information technology and libraries, 24(2), p3.
[https://doi.org/10.6017/ital.v24i2.3365]

- Blandford, A., & G. Buchanan, (202), "Usabilty for Digital Libraries", Procedings of the Second ACM/IEE-CS Joint Conference on Digital Libraries, New York, ACM Pres, p424.
- Turner, S, "The HEP rest for grading web site usability", Computers in Libraries, 22, 10, 37-39, (2002), 3(2), p46-67.
- Hyun-Ki Lee, Janghoon Yang, Mobile Web Magazine Design based on Kansei Engineering and Universal Design, Journal of Digital Contents Society, 18(7), p1227-1237, (2017).
-
Negash, S., Ryan, T., & Igbaria, M., (2003), Quality and effectiveness in web-based customer support systems, Information & management, 40(8), p757-768.
[https://doi.org/10.1016/S0378-7206(02)00101-5]

- Shim, Jum-Sook, (2007), An Empirical Study of Continuous Use of theWeb Blog Sites : Centeringon the Committment Model, Keimyung University, Doctoral dissertation.
-
Seddon, P. B., (1997), A respecification and extension of the DeLone and McLean model of IS success, Information systems research, 8(3), p240-253.
[https://doi.org/10.1287/isre.8.3.240]

-
Yoon-Sun, Bae, A study on mobile web design for efficient delivery of information, Journal of Digital Contents Society, 12(3), p263-270, (2011).
[https://doi.org/10.9728/dcs.2011.12.3.263]

-
Jones, G. J., & Brown, P. J., (2003, September), Context-aware retrieval for ubiquitous computing environments, In Workshop on Mobile and Ubiquitous Information Access, p227-243, Springer, Berlin, Heidelberg.
[https://doi.org/10.1007/978-3-540-24641-1_17]

-
Bailey, J. E., & Pearson, S. W., (1983), Development of a tool for measuring and analyzing computer user satisfaction, Management science, 29(5), p530-545.
[https://doi.org/10.1287/mnsc.29.5.530]

-
Park, Gyeong-Won, & Kim, Chang-Su, & Ahn, Hyun-Sook, (2017), The Impact of Mobile Commerce Quality on Customer Satisfaction and Repurchase Intention : Focusing on Moderating Effect Mobile Familiarity, Korean Institute of Information Technology, 15(7), p149-162.
[https://doi.org/10.14801/jkiit.2017.15.7.149]

- Jung, Kyung-Soo, & Lee, Won-Bin, (2008), A study on the factors which affect the usage intention of mobile Commerce, Korean Association of Industrial Business Administration, 17(3), p153-174.
- Choi, Heon, (2009), A study on the factors which affect the usage intention of mobile shopping, Hanyang University, Master dissertation.
- Lee, Sung-Ho, (2006), The Effects of Ubiquitous Attributes of Mobile Contents on Perceived Interactivity and Behavioral Outcome, Seoul National University, Doctoral dissertation.
- Dularcher Research, (1999), Mobile Commerce Report, Dularcher Research Inc.
- Nielsen, J., (1994), Usability engineering, Elsevier.
-
Jeng, J., (2005), What is usability in the context of the digital library and how can it be measured?, Information technology and libraries, 24(2), p3.
[https://doi.org/10.6017/ital.v24i2.3365]

-
Jarvenpaa, S. L., & Todd, P. A., (1996), Consumer reactions to electronic shopping on the World Wide Web, International Journal of electronic commerce, 1(2), p59-88.
[https://doi.org/10.1080/10864415.1996.11518283]

- Noh, Mi-Jin, (2005), An Empirical Study on the Factors Influencing the User Acceptance of Mobile Services, Kyungpook National University, Doctoral dissertation.
-
Jung, Won-Jin, (2012), The Effects of Perceived Information Quality of Mobile Shopping Malls on Smartphone Users' Intention to Use the Shopping Malls, The Journal of Information Systems, 21(3), p71-97.
[https://doi.org/10.5859/KAIS.2012.21.3.71]

-
DeLone, W. H., & McLean, E. R., (1992), Information systems success: The quest for the dependent variable, Information systems research, 3(1), p60-95.
[https://doi.org/10.1287/isre.3.1.60]

-
Davis, F. D., Bagozzi, R. P., & Warshaw, P. R., (1989), User acceptance of computer technology: a comparison of two theoretical models, Management science, 35(8), p982-1003.
[https://doi.org/10.1287/mnsc.35.8.982]

- Na, Youn-Kue, (2010), A Study of the Purchase Behavior of Fashion Merchandise for the Internet Shopping-mall Using Extended Technology Acceptance Model(ETAM); In Case of Perceived Value, Risk and Trust in Internet Shopping, The Journal of Internet Electronic Commerce Resarch, 10(3), p27-49.
-
Jarvenpaa, S. L., Tractinsky, N., & Vitale, M., (2000), Consumer trust in an Internet store, Information technology and management, 1(1-2), p45-71.
[https://doi.org/10.1023/A:1019104520776]

- Ji-Won, Lee, (2016), The Influences of TBSS characteristic factors on Attitude, Satisfaction and Reuse Intention : Moderating Effects of Self-efficacy and Fall-back option, ChonBuk National University, Doctoral dissertation.
저자소개

2002년 : 공주대학교 대학원 (교육학 석사)
2018년 : 숭실대학교대학원 재학중(공학박사)
2005년~현재 : ㈜디자인아트플러스 대표
※관심분야: 웹디자인, 이미지검색, 모바일쇼핑 등

1996년 : 충남대학교 자연과학대학
2017년 : 성균관대학교 경영전문대학원
2017년~현재 : 숭실대학교 IT정책경영학과 박사과정
※관심분야: 인공지능, 딥러닝, 컴퓨터 비전과 시각적 인지 등

2003년: 정보관리기술사,정보시스템감리사
2008년: 서울시립대 경영정보학(석사)
2018년 현재 ㈜티지에서 컨설팅 프로젝트 수행 중
※관심분야:블록체인, 정보자원관리, 빅데이터 등

1979년: 서울대학교 문학사 졸업
1983년: 서울대학교 경영학과(경영학 석사)
1989년: 미국 퍼듀대에서 MIS 박사
1989~90년: 미국 휴스턴대학교 조교수 역임.
1993년~현재: 숭실대학교 경영학부 교수
※관심분야: 웹디자인, AI, 빅데이터
