A Study on the Recommendation of Contents using Speech Emotion Information and Emotion Collaborative Filtering
Copyright ⓒ 2018 The Digital Contents Society
This is an Open Access article distributed under the terms of the Creative Commons Attribution Non-CommercialLicense(http://creativecommons.org/licenses/by-nc/3.0/) which permits unrestricted non-commercial use, distribution, and reproduction in any medium, provided the original work is properly cited.

Abstract
In this paper, the emotion is defined as six situations (normal, happy, sadness, anger, surprise, boredom) to recommend the matched content considering the user 's emotional information, and classified the normalized speech as the speech emotion information GAFS algorithm and SVM algorithm are used. Also, contents (image, music) information were classified into content emotion information by factor analysis, correspondence analysis, and Euclidean distance. Finally, we designed the content suitable for user's emotion to recommend to mobile application by predicting user's emotional preference by using emotion information value recognized through speech information classified by emotion and collaborative filtering technique. For the performance evaluation, we performed the verification through the MAE algorithm. As a result of the performance evaluation, it is expected that the user 's characteristics and satisfaction can be considered by recommending the content according to the user' s emotion.
초록
본 논문에서는 사용자의 음성 감성 정보를 고려하여 매칭 된 콘텐츠를 추천하기 위해 감성을 6가지의 상황(보통, 기쁨, 슬픔, 화남, 놀람, 지루함)으로 정의하였으며 정규화 된 음성을 음성 감성 정보로 분류하기 위해 GAFS 알고리즘과 SVM 알고리즘을 사용하였다. 또한 콘텐츠(이미지, 음악) 정보를 요인분석, 대응 일치 분석, 유클리디안 거리를 이용하여 콘텐츠 감성 정보로 분류하였다. 마지막으로 감성에 따라 분류된 음성 정보와 감성 협업 필터링을 이용하여 감성 정보 값에 따라 감성 선호도를 예측함으로써 사용자 감성에 맞는 콘텐츠를 모바일 애플리케이션에 추천하도록 설계하였다. 성능 평가를 위해 본 논문에서는 MAE 알고리즘을 통해 검증을 수행하였다. 성능 평가 결과 사용자의 감성에 따른 콘텐츠를 추천함으로써 사용자의 특성 및 만족도를 고려할 수 있을 것으로 기대한다.
Keywords:
Collaborative filtering, Emotion recognition, GAFS algorithm, Recommendation system, Speech emotion information, SVM algorithm키워드:
음성 감성 정보, 협업 필터링, 감성 인식, 추천 시스템, GAFS 알고리즘, SVM 알고리즘Ⅰ. Introduction
The emotional ICT technology is emerging as a core technology of smart mobile technology and wearable technology. It automatically senses users’ emotions in everyday life and processes emotional information according to users’ environment in oder to provide emotional customized service. The emotional signal sensing technology is a micro/ultra-precise sensor sensing bio-signals, environment, situation information, video signals and speech signals generated by the autonomic nervous system activity depending on human emotional changes in the non-restraint/awareness status. It processes and analyzes signals acquired from sensors. Based on this, it recognizes human emotions. Also, it verifies and standardizes human emotions to informationize. Finally, the emotional service technology processes information depending on the user's situation and provides customized emotional products or services[1].
The emotional recognition using speech has been referred to many results of studies about speech recognition. However, there is a big difference in selection of feature extraction and pattern recognition algorithm. The speech recognition uses modeling factors of phoneme for specific vector selection. On the other hand, it uses rhythm factors for emotion recognition. The pattern recognition algorithm selection is also a very important factors with feature selection. And pattern recognition algorithm can be differently selected depending on the method of modeling using the extracted features. In this way, emotional information represents the current emotional state of the user. It is used in various ways such as cultural content service, music recommendation and users’ emotional monitoring depending on emotional states[2][3].
Also, studies on recommendation techniques considering users’ tendency have been actively conducted in order to effectively reflect various requirements of users. An application containing a recommendation technique is being used to predict a user's preference and recommend the item[4]. As a representative recommendation technique, there are content-based and collaborative filtering techniques. The content-based recommendation technique refers to a technique of analyzing the similarity between contents and user preferences directly and recommending new content based on this. On the other hand, the collaborative filtering is a technique of analyzing other users representing certain users and similar characters and recommending the content preference[5]. In order to improve the users’ satisfaction, the recommendation technique should reflect the user's characteristics and situations such as personal preference and emotion. However, most of the recommendation techniques do not take these characteristics into account therefore it cannot improve the users’ satisfaction.
This paper proposed a system for recommending emotional contents (images, music) using personal speech emotion information that is personal characters in order to implement recommendation system with high satisfaction of users. This paper measured and analyzed the users’ speech information to classify emotional information depending on 6 kinds of emotional information (neutral, happy, sadness, angry, surprise, boredom). In order to enhance the reliability of the recommendation system, the collaborative filtering is used to extract the emotion preference by recognizing the emotion of the user for each content data and implement the recommendable system by predicting users’ emotional preference. In other words, it is to verify the reliability of system and recommending system about the content (image, music) matched according to the users’ 6 kinds of emotions (neutral, happy, sadness, anger, surprise, boredom) using predicted emotional preference and emotional information analyzed by speech signal.
Ⅱ. System Configuration and Design
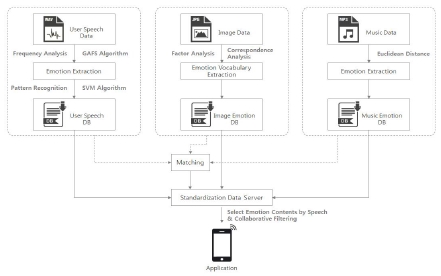
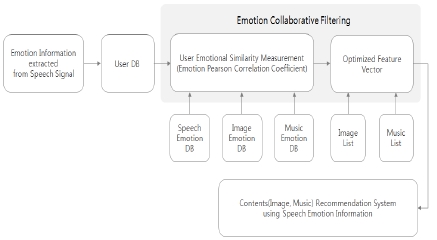
The recommendation system using speech emotion information and collaborative filtering contents (image, music) is consisted of emotion classification module, emotional collaboration filtering module and mobile application. The system configuration of this paper is shown in Fig. 1.
2-1 Emotion Classification Module
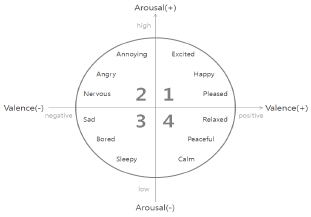
A systematic emotional model should be selected In order to predict the appropriate emotional state in the field of emotional recognition. Human emotions are diverse and complex. They are expressed in various adjectives. Therefore studies have been actively conducted to quantify emotional states and clarify the correlation between emotional states. Currently, there are emotional models that is widely used in the field of emotional recognition; Russell model and Thayer's Valence-arousal model which expresses human emotion as two-dimensional area of preference-non-preference and activity and inactivity. The Valence-arousal model expresses emotions in a two-dimensional space and is widely used in emotion recognition studies as emotional models. The Russell model is based on an adjective which has the disadvantage of overlapping meanings or ambiguous adjective expressions[6]. However the Thayer model improved these disadvantages. It defines various emotional states by the Valence axis, showing the tendency toward emotion and the Arousal axis, showing the intensity of emotion[7].
The second method is selecting representative emotions such as pleasure, surprise, fear, anger, and sadness. The Valence-arousal model has the advantage of selecting various emotions by continuously expressing human emotional states but there are ambiguous emotions that are difficult to distinguish between two-dimensional indicators and various emotional adjectives. In the case of representative emotion, it is clear in emotion expression therefore the speech can be easily classified according to emotion. It is used as the emotion expression in the most speech-based emotion recognition field. Fig. 2 shows the Thayer's emotional model.
Therefore, this paper used six emotional models of representative emotions such as neutral, happy, sadness, anger, surprising and boredom, which are often used in the field of emotional recognition, using representative emotional expressions with clear emotional expressions.
In order to perform emotional recognition using speech, it is necessary to select characteristics that can distinguish emotions well, rather than features commonly used in speech recognition. The Mel Frequency Cepstral Coefficient(MFCC) is a typical parameter that is used to represent phonemes of speech and the rhythmic factors that is used for emotion recognition are pitch, energy, and pronunciation rate. These speech parameters are used for emotion recognition by calculating statistical information such as pitch average, pitch standard deviation, pitch maximum value, energy average and energy standard deviation which are calculated for a defined section of speech signal. In addition, GMM, HMM, SVM, ANN and other algorithms are being used in speech recognition and speaker recognition as identification methods used in the pattern recognition step[8]. Therefore this paper extracted the delta values of the MFCC and the feature coefficients with the pitch, energy, the prosodic features of the speech. And maximized the mean, standard deviation and maximum value of each feature value finally in order to optimize it through Genetic Algorithm Feature Selection(GAFS) algorithm. This paper used the SVM algorithm for pattern recognition. And speech emotion DB was constructed using the emotion information.
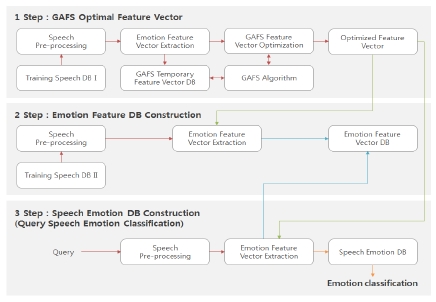
The speech preprocessing process for extracting reliable feature vectors is consisted of speech signal segmentation, Hanning window / Hamming window and end-point detection as shown in Fig. 3.
The input speech signal is sampled at 16 kHz and is used to extract features by 16-bit Pulse Code Modulation(PCM). In order to remove noise from the sampled speech signal, Wiener Filtering is needed.
The sampled speech signal uses Hannig window for pitch extraction and 50% overlapping Hamming window for frames.
In addition, the end point detection is to extract the feature vector only in the speech section by distinguishing the speech section from the non-speech section in the speech signal. This is to prevent deterioration of system performance caused by false speech analysis and feature vector extraction in the non-speech part.
In order to recognize emotion recognition through speech, it is necessary to accurately identify how each emotion makes speech. Emotion included in speech is mainly expressed by rhyme information and rhythm information includes pitch change, energy change and pronunciation rate. For emotional recognition, features that reflect this rhythm information in speech should be found to modelize.
Considering how rhyme information is associated with emotional speech, we can see that the pleasant and angry speech has a high energy and pitch, and a high-speed pronunciation rate, however the sad or boring speech has low energy and pitch overall in the statistical view[9]. In this way, the pitch and energy ups and downs of speech can be modeled using statistical information such as the pitch average and the energy average of the entire speech.
The speech feature vector extracted the MFCC and the delta value of each feature coefficient which have pitch, energy and phoneme features with a prosodic feature in every frame and finally obtained the mean, standard deviation and maximum value of each feature coefficient.
Fig. 4 is a flowchart of speech signal feature vector extraction and emotion classification proposed in this paper.
In this paper, pitch extraction is performed by using a Haning window with a size of 60 ms, including 2 to 3 pitches per frame and passing through a low-pass filter of blocking abatement frequency, 800 Hz and using Average Magnitude Difference Function(AMDF) shown as Equation (1).
It used a method of determining the minimum pitch value among the extracted pitch candidates.
| (1) |
Here, N is the number of samples and xn (i) is the sample value of i, of n frame. It is the MAXLAG value of the extractable pitch period.
The extracted pitch candidates are smoothed to prevent the pitch between frames from changing abruptly. If the unvoiced frame section (1 to 2 frames) of the short section is located between the voiced sounds, it is processed by a voiced sound with an average pitch value before and after the frame.
Energy uses commonly used logarithmic energy and Teager energy. The logarithm energy is obtained by summing the absolute values of the sampled signal in the frame. The teager energy is proposed by Kaiser. It is obtained by the same method in Equation (2) by applying filter bank in complex and sine wave signal and dividing the single frequency[10].
| (2) |
Here, fn (i) is i filter bank coefficient of n frame and FB is the number of frequency bands. On the other hand, teager energy shows that strong characteristics on noise and dynamically enhances the speech signal.
The MFCC with phoneme characteristics is widely used in the field of speech recognition and can express the speech characteristic on the Mel-Frequency similar to the human auditory characteristic. This paper used 12th order, MFCC.
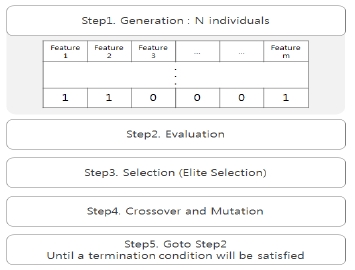
This paper used GAFS algorithm to optimize the feature vector. Feature selection is a nonlinear optimization problem. In particular, feature extraction in the emotion recognition field is a very difficult problem to find a feature set that can satisfy the emotion recognition performance enhancement, which is an objective function among the feature sets ranging from several tens of dimensions. One of the studies on GA algorithm has been conducted to solve this optimization problem. It is domain-independent (combinatorial optimization). The GA algorithm can be applied in anywhere if the function that can obtain outputs is defined. It begins with a population, which is a collection of individuals created by a computer in the search space of all possible malicious intents to given function. And it is an algorithm to reach the optimal solution by repeating the process of evolving into a more specific object and using objective function that measures how well the object fits the environment[11].
In this paper, the GAFS algorithm is used to optimize the feature vector as shown in Fig. 5. When initially generating a set of efficient solutions, we adjust the length of the chromosomes depending on the number required by the objective function. Since the objective function is composed of 8 features, the length of the chromosome is fixed at 10. Step 1 is completed by creating Population Size N that has predetermined objects with 10 chromosome length. In 2 step, N objects are assigned to the objective function to find each fitness. After selecting the Elite Selection method using the determined fitness, crossing and mutation were performed according to the predetermined crossing rate and mutation rate and the process of step 5 was repeated in step 2 until the termination condition gets satisfied.
The SVM algorithm is used to pattern the optimized feature vectors as emotion information. The SVM algorithm is used not only in finding hyperplane that minimizes the number of decision errors between two classes but also in many applications because it is a very simple structure compared with a neural network and has advantages of generalization[12][13]. For the kernel functions, Gaussian and polynomials were used in this paper.
In this paper, we used RGB, a web-based color mode to extract image emotion information and selected 20 color emotion models defined by HP's ‘The Meaning of Color’. Then we analyzed the factors through the questionnaire of the measurement, correspondence analysis and created the emotional space for each color.
RGB was extracted from a specific point of the image and RGB according to each color was stored in the database. In order to judge the degree of emotion, three dimensional coordinates of x, y, z of each RGB of the color mall were confirmed. The distance from the extracted color is calculated and included in the color model which is the shortest distance. Each image color model distribution value is stored in each of 20 color model fields(database).
The analyzed color image values graphically represent the measured values of each color. The highest measured value is sequentially matched to the emotional word[14].
Coordinates of emotional vocabulary and emotional elements can be obtained by using two-dimensional space. The coordinates of the emotional vocabulary and emotional elements can be used to measure distances and identify relationships. In each coordinate, as the value of distance was decreased, it has deeper meaning(inverse proportion) and the color distribution has deeper meaning as the value of distance was increased(direct proportion). Therefore the ratio was measured by reciprocal number of distance. Equation (3) represents this function.
| (3) |
The Equation (3), i is an emotional vocabulary, and k is an emotional element. Using the Equation (3), the distance ratio results of the emotional vocabulary and the emotional element can be obtained. The numerator is the distance between the actual emotional vocabulary and the emotional element, and the denominator is the reciprocal sum of the distance to the emotional vocabulary and 20 emotional elements.
Through music information and each users’ emotional history, it recommends music suitable for the current emotion according to the users’ emotion information. For the music emotion information, we used the Euclidean distance for the similarity between sound sources in this paper[15].
It is the algorithm that finds the music with the most similarity by extracting the information of the most executed in most similar to the current emotion of the users.
| (4) |
Equation (4) is a formula that obtains scores based on the current status that is, uEmontione the songs that the user has listened to. i represents music in the music emotion DB and e means i emotion information in the music emotion DB. Therefore, all songs can be ranked by the music emotion DB information through Equation (4).
In order to obtain the music list up to the above x, emotion information standardization was performed as Equation (5) to obtain Euclidean distance.
| (5) |
Emotioni,k is the value assigned to the falsetto category of the tune. Lastly, the Euclidean distance was calculated and the recommendation list was generated by sorting the order from the smallest value.
| (6) |
Equation (6) calculates the similarity between music with the highest value obtained from Equation (4) and the standardized emotion information. Here, i contains all the songs of the music emotion DB.
2-2 Collaborative Filtering Module
Collaborative filtering is a system for predicting the preference of item by collecting the preference of other users similar to the users. It assumes that there are general trends and patterns in the tastes of groups and people, and that people's past tastes will be maintained in the future[16]. In this paper, users recommend contents (image, music) according to users’ emotions by merging with static emotional information collaborative filtering which is received in real time using characteristics that the preferred items are different depending on emotions. Fig. 6 is a schematic diagram of the filtering module for emotional collaboration.
The Pearson correlation coefficient is an algorithm that calculates the similarity between two users using the evaluation value of items commonly evaluated by two users. The Pearson correlation coefficient considering emotional information includes emotion information and executes dynamic emotion information and grouping effect using personal information. Then we measured the similarity of each user about contents depending on users’ emotions using average score data of group users. The measured similarity has a value from -1 to +1, and as it closes to +1, it is similar user and as it closes to –1, it is the opposite side. If the similarity is zero, it means a user who has no relation. Equation (7) is an expression of emotional Pearson correlation coefficient considering emotion information.
| (7) |
wa,u,e means a similarity between a user and a neighbor user and a means a user, u means a neighbor user and e means emotion. m is the number of items evaluated in common by a and u. On the other hand, ra,i,e and ru,i,e is the average score of a considering e for item i and the average score of u considering e for item i. and is the average of the user a’s overall ratings and the user u’s overall ratings toward e. Lastly, the function means the user a’s standard deviation and the user u's standard deviation toward e.
The score prediction of the items that the user has not experienced is performed by using the similarity degree among the measured users and the rating data of the group users constructed after the clustering using the user's personal information. The personalized content recommendation can be made by using users’ evaluation value and emotions according to the situation. Equation (8) is an evaluation value prediction algorithm considering emotion information.
| (8) |
pa,i,e is a prediction value of item i, and a means user, u means a neighboring user, e means emotion and n means a neighboring user who has negative evaluation value. and means the average of the user a's overall ratings and the average of the user u’s overall ratings toward e and ru,i,e means the user u's rating toward item i considering e. Lastly, wa,u means similarity between users of emotional Pearson correlation coefficient and mean similarity.
Ⅲ. System Implementation Results and Performance Evaluation
This paper proposed a system for recommending matched content (image, music) considering users’ emotional information. The GAFS algorithm and SVM algorithm are used to classify the normalized speech as the speech emotion information. Also, contents (image, music) information were classified into content emotion information by factor analysis, correspondence analysis, and Euclidean distance. Finally, emotional preference was predicted by collaborative filtering. In this paper, we implemented a system that recommends content according to users’ emotions by matching emotion information and emotion preference.
First, the features of the paper data measured using the microphone of the smart phone were extracted and analyzed using the GAFS algorithm and the SVM algorithm. Then it is stored in speech emotion DB as standardized 6 steps (neutral, happy, sadness, angry, surprise and boredom). In addition, the image emotion DB measures the distance between the emotional color and the emotional vocabulary by arranging the emotional color and the emotional vocabulary in the same two-dimensional space plane to judge the related information. We extract the representative emotional vocabulary of the measured information through factor analysis and perform verification. This data is stored in the image sensitivity database in 6 defined levels. The music emotion DB is able to recommend the music suitable for the current emotion through the information of the music and the emotion information of the user using the Euclidean distance.
In this paper, we used a total of 400 speech signal data which is expressed by 6 kinds of expressions by each of 15 men and women for personalized speech emotion recognition. Finally, we focused on personalization using emotion recognition of speech signal. 16kHz and 16bit recorded sentences are 30 kinds of ordinary and simple ones, and sentence length is limited to 6~10 syllables.
The speech emotions constituting the speech emotion DB is consisted of 30 kinds of user-expressed speeches and the emotion is categorized by cross-validating the SVM algorithm as shown in Table 1 in order to confirm whether the emotion is appropriately classified according to the users’ emotion.
Table 1 shows the recognition rate for standardized emotion in 6 stages according to speech using SVM algorithm. The average recognition rate was 81.43% for the standardized emotion of neutral, happy, sadness, angry, surprise and boredom.
Also, the emotion that is mistaken by the SVM algorithm was boredom and sadness and the most perceived emotion was surprise.
We used Mean Absolute Error(MAE) algorithm, which is widely used to evaluate the performance of the recommendation system proposed in this paper. The accuracy of the recommendation system is determined by comparing the users’ expected preference with the actual preference of the new item. It was conducted to examine how the predicted estimate and the users’ actual estimates are on average. The data set used in the experiment used contents (image, music) data based on emotion generated through the speech emotion information.
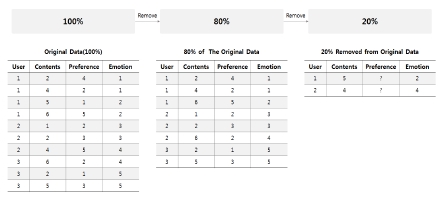
The experimental method removed 20% of the data randomly from the original data (100%). Here, the original data is content (image, music) data based on the emotion generated through the speech emotion information. 20% was removed and the remaining 80% of the data was used to predict 20% of the data. Fig. 7 is an example of removing 20% of the original data.
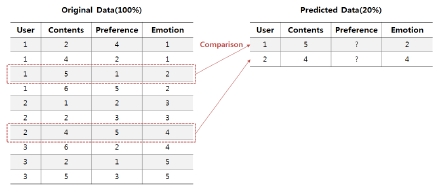
The performance of the recommendation system is evaluated by comparing 20% of the predicted data with 20% of the original data. It is to examine at how similar 20% of the predicted 20% of the original data is. Fig. 8 is an example of comparing predicted preference data.
The MAE algorithm is an average of absolute errors between the values of the two groups to be compared and is an indicator of how similar the predicted estimates are on average to the actual estimates with the users. The performance of the recommendation system is better as the MAE value is lower.
It indicates how accurately the recommendation system predicts the users’ preference. If the value of the recommended MAE is 0, the recommendation system can be considered correct. Equation (9) represents the MAE algorithm.
| (9) |
pi means the user p's actual preference and qi means user p’s predicted preference. n means the number of content actually used by the user P.
In this paper, the MAE performance evaluation algorithm is normalized. The value of MAE has a value from 0 to 1. And 0 does not match all but 1 does match all. Equation (10) is an equation including the normalization equation in the MAE algorithm.
| (10) |
pi means the user p’s actual preference and qi means user p’s predicted preference. n means the number of content actually used by the user p and MAX means maximum value of pi - qi and MIN means the minimum value of pi - qi.
Table 2 shows the performance evaluation results of the emotions of the recommendation system using the normalized MAE algorithm. Performance evaluation showed that the recommended system has high performance due to an average accuracy of 87.2%.
In this paper, we proposed contents (image, music) recommendation system using personal speech emotion information and collaborative filtering as mobile application. And it recommends the content by predicting the users’ preference using the recognized emotion information value.
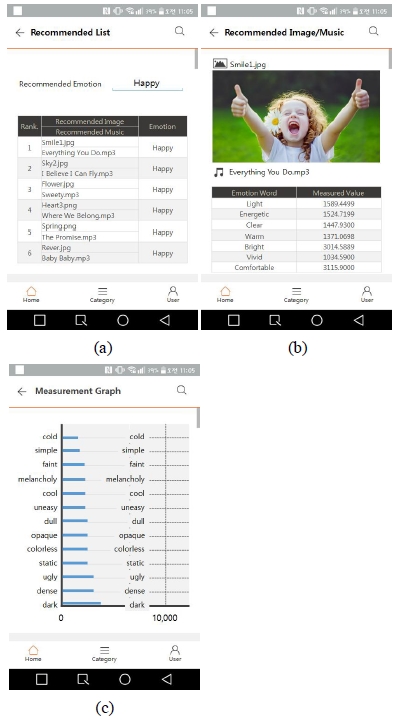
Fig. 9 shows the results of implementing the emotional content (image, music) recommendation system based on users’ speech emotion information and collaborative filtering implemented by the application in this paper. Fig. 9 (a) shows recommended emotional content and measured values, (b) shows emotional content recommendation list and (d) shows emotional content measurement graph.
The system implemented in this paper standardized the contents emotion information in 6 kinds of steps by using user's speech emotion information and collaborative filtering. After matching the standardized emotional information according to the emotional information of the user, the preferred content (image, music) according to the pattern of the user is searched in the database and recommended for each rank. By expressing emotional analysis chart of the analyzed contents, it recommended the optimized contents to users.
Ⅳ. Conclusions
In this paper, we standardized contents emotion information to 6 steps(neutral, happy, sadness, anger, surprise, boredom) by using users’ emotional information and collaborative filtering. The emotional information of speech and contents GAFS algorithm, SVM algorithm, factor analysis, correspondence analysis and Euclidean distance were used to extract reliable data. And it was conducted to improve the reliability by predicting users’ emotional preference using collaborative filtering. In this paper, we proposed recommending contents (image, music) according to users’ speech emotions by suggesting contents according to the obtained emotion information for individuals.
Therefore, it is expected that the emotion recommendation system proposed in this paper will be able to improve the users’ characteristics and satisfaction by recommending content according to users' emotions.
In future studies, we try to improve the recognition rate of the speech emotion through various algorithm analysis and research, and implement the recommendation system using the various emotion information and situation information.
Acknowledgments
This study was supported by research funds from Chosun University, 2018.
References
- Y. J. Lee, and I. C. Youn, “Emotion recognition technology for human-machine interface”, Journal of Mechanical Science and Technology, 55(3), p42-46, (2015).
- J. H. Bang, and S. Y. Lee, “Call Speech Emotion Recognition for Emotion based Services”, Journal of KIISE, 41(3), p208-213, March), (2014.
- T. M. Lee, D. W. Kang, K. J. Cho, S. J. Park, and K, H. Yoon, “Developing application depend on emotion extraction from paintings”, Journal of Digital Contents Society, 18(6), p1033-1040, October), (2017.
- S. Z. Lee, Y. H. Seong, and H. J. Kim, “Modeling and Measuring User Sensitivity for Customized Service of Music Contents”, Journal of Korean Society For Computer Game, 26(1), p163-171, March), (2013.
- B. H. Oh, J. H. Yang, and H. J. Lee, “A Hybrid Recommender System based on Collaborative Filtering with Selective Utilization of Content-based Predicted Ratings”, Journal of KIISE, 41(4), p289-294, Apr), (2014.
-
J. Posner, J. A. Russell, and B. S. Peterson, “The circumplex model of affect: An integrative approach to affective neuroscience, cognitive development, and psychopathology”, Development and Psychopathology, 17(3), p715-734, September), (2005.
[https://doi.org/10.1017/s0954579405050340]

- H. M. Sim, A Emotion-based Music Classification and Applying to Note Generation of Rhythm-Action Game, M.S dissertation, Chung-Ang University, (2012).
- K. D. Jang, Speech Emotion Recognition for Affective Human-Robot Interaction, M.S dissertation, Chungbuk National University, (2007).
- B. S. Kang, A Text-independent Emotion Recognition Algorithm Using Speech Signal, M.S dissertation, Yonsei University, (2000).
-
S. Rosen, and S. N. C. Hui, “Sine-wave and noise-vocoded sine-wave speech in a tone language: Acoustic details matter”, The Journal of the Acoustical society of America, 138(6), p3698-3702, December), (2015.
[https://doi.org/10.1121/1.4937605]

- C. H. Park, and K. B. Sim, “The Pattern Recognition Methods for Emotion Recognition with Speech Signal”, International Journal of Control, Automation, and Systems, 12(3), p284-288, (2006).
-
T. W. Rauber, F. D. A. Boldt, and F. M. Varejãao, “Heterogeneous feature models and feature selection applied to bearing fault diagnosis”, IEEE Trans. Ind. Electron, 62(1), p637-646, (2015).
[https://doi.org/10.1109/tie.2014.2327589]

-
S. U. Jan, Y. D. Lee, J. P. Shin, and I. S. Koo, “Sensor Fault Classification Based on Support Vector Machine and Statistical Time-Domain Features”, IEEE Access, 5, p8682-8690, (2017).
[https://doi.org/10.1109/access.2017.2705644]

- J. Li, and J. Z. Wang, “Automatic linguistic indexing of pictures by a statistical modeling approach”, IEEE Trans. Pattern Analysis and Machine Intelligence, 25(9), p1075-1088, (2003).
- H. S. Choi, “Music Recommendation System Using Extended Collaborative Filtering Based On Emotion And Context Information Fusion For Music Recommendation”, M.S dissertation, Konkuk University, (2011).
-
J. Byun, and D. K. Kim, “Design and Implementation of Location Recommending Services Using Personal Emotional Information based on Collaborative Filtering”, Journal of the Korea Institute of Information and Communication Engineering, 20(8), p1407-1414, August), (2016.
[https://doi.org/10.6109/jkiice.2016.20.8.1407]

저자소개

2005 : Chosun University (M.S in Computer Science & Statistics)
2015 : Chosun University (Ph.D in Computer Science & Statistics)
2012~2015 : Senior researcher at Shinhan Systems
2012~2017 : Adjunct professor at Gwangju Health University
2018~now : Assistant professor at Chosun University
※Research Interests: Artificial Intelligence, Bioinformatics, BigData, Emotion Engineering, IoT

2001 : Gwangju Univ. Graduate School(Master of Politics)
2014 : Honam Univ. Graduate School(Doctorate in business administration)
1991~2003 : Mudeung Ilbo
2014~2017 : Honam Univ. adjunct professor
2014~now : Gwangju Daily News, executive director
※Research Interests: IT Convergence, Emotion Engineering, Marine Tourism, Ecotourism

2006 : Chosun University (M.S in Information and Communication Engineering)
2015 : Chosun University (Ph.D in Information and Communication Engineering)
2011~2013 : Assistant professor at Chosun University College of Science & Technology
2014~now : Assistant professor at Chosun University
※Research Interests: Multimedia Image Processing, BigData, Computational Thinking, Deep learning
